Weather Canada
iOS App
Design for iOS App.
Environment and Climate Change Canada
Mission
Create App forecast: Current conditions, 24-hour forecast and 7-day forecasts for location in Canada
The Challenge
We needed to create a beautiful and clear weather application, as simple as possible and with convenient usage options.
A weather app should use Weather Underground as its weather data provider, one of the most advanced weather forecast providers providing ultra-accurate data wherever the user is.
My Role
Product Designer
Tools Used
Figma, FigJam
Google doc,
Adobe Suite
Protect Duration
5 weeks
Process
Empathized and learned about our users
- User interviews
- Stakeholder interview
- Survey
- Data analysts
- Metrics
- Competitors
- Observation
- Clustering insights
- Context mapping
- Customer journey map
Defined our users’ needs, real problem and discovered our insights
- Personas
- Empathy map
- User journey
- Storyboard
- Problem statement
- Task analysis
- Comparative analysis
Ideated by challenging assumption and creating ideas for innovative solutions
- Brainstorm sessions
- Mind maps
- Affinity maps
- Storyboards
- Card sorting
- User journey
- User flow
- Information architecture
- Business model canvas
- Design principles
Prototyped to implement the solutions and simulate user experience
- Detailed user flows
- Micro-interactions
- Mockups
- Interactive prototypes
- Wireframes
- High-fidelity design
- Design hand-off
- HTML/JS prototypes

Tested solutions. Validated with users.
- Usability testing
- A/B testing
- SUS surveys
- Heuristic evaluation
- Quality assurance
- Analytics
- Performance testing
- Observations
- Desirability evaluation
- Metrics
My contribution:
User interviews, Data analysis, Observation, Customer journey map, Persona creation, User journey, Storyboard, Affinity maps, User journey, Design principles, Micro-interactions, Mockups, Wireframes, High-fidelity design, Usability testing, A/B testing, Heuristic evaluation, Observations.
Empathize Phase
| User interviews
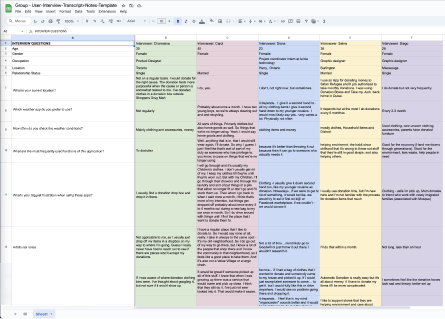
Created User Interview Transcript with the following questions:
- What is your age?
- What is your gender?
- What is your occupation?
- What is your location?
- What is your relationship status?
- What is your current location?
- Which weather app do you prefer to use?
- How often do you check the weather conditions?
- What are the most frequently used functions of this application?
- Why do you need to use those options/functions?
- + Additional notes
| Customer journey map
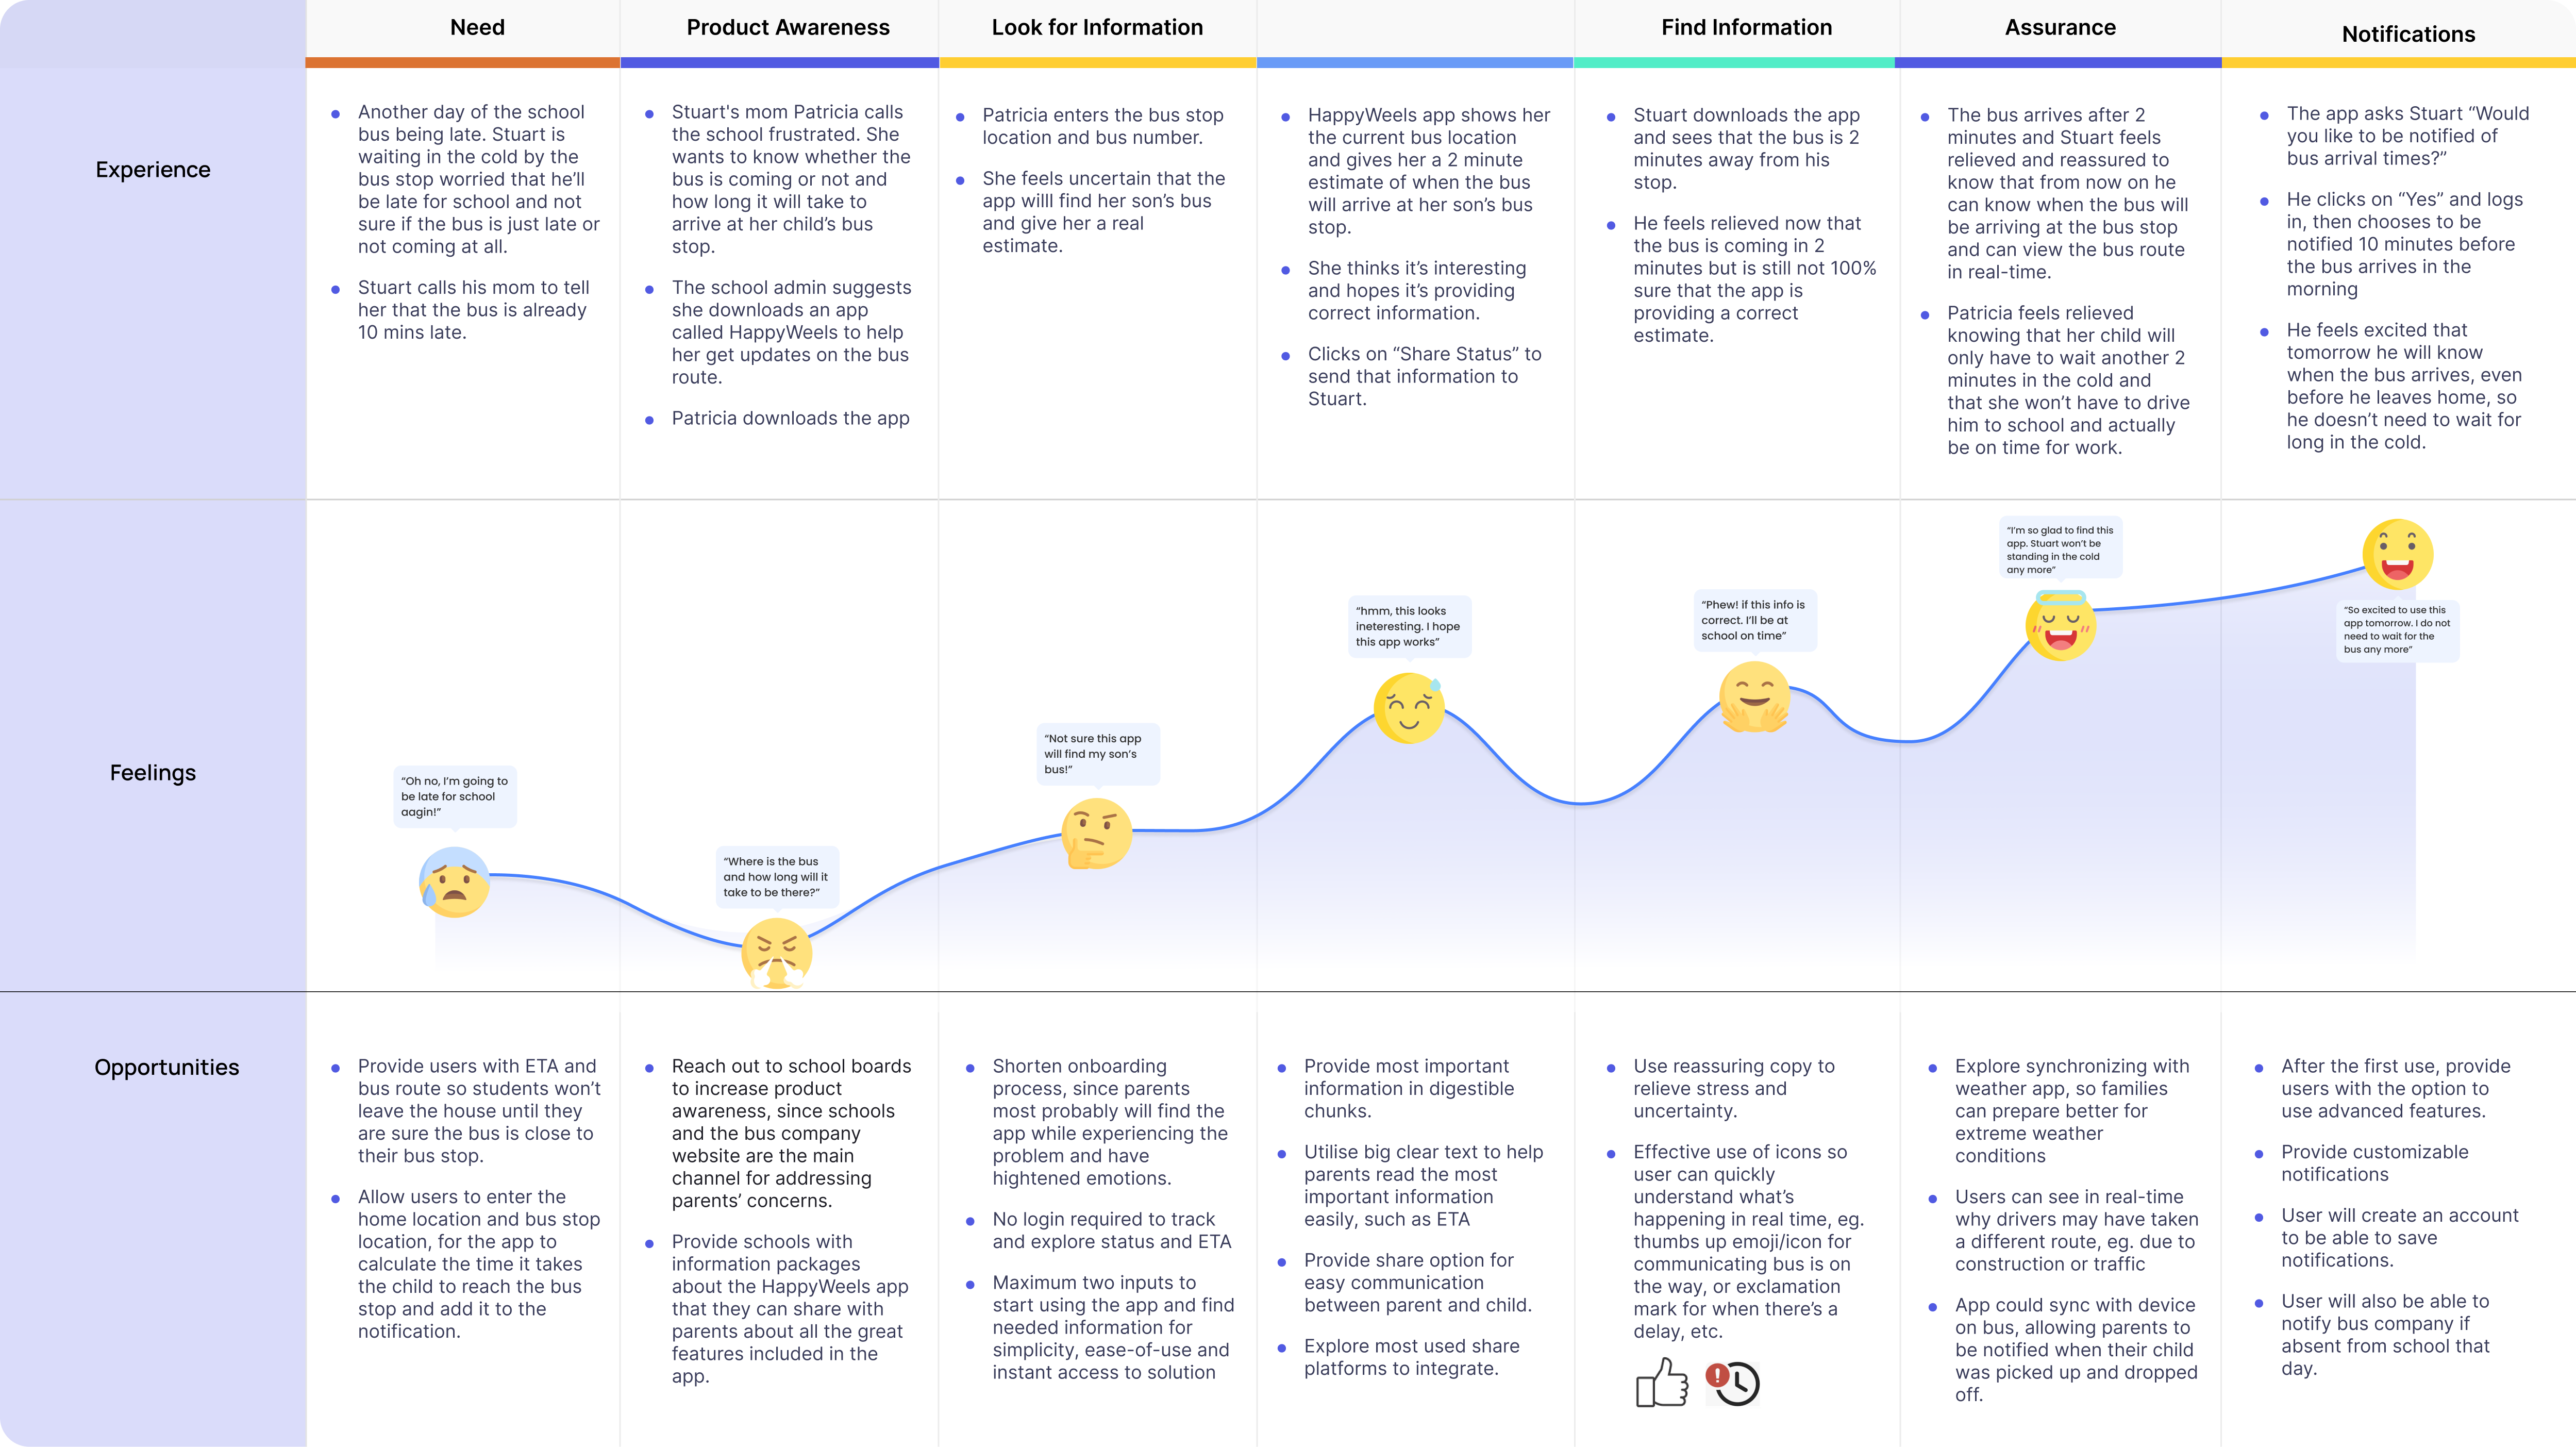
I visualized customer journey map and saw how the pieces of necessary data fit together.
From the main points, I took experience, feelings, and opportunities. To analyzed the steps that our user would do I created the journey:
- Needs
- product Awareness
- Look for Information
- Find Information
- Assurance
- Notifications
| Data analysts
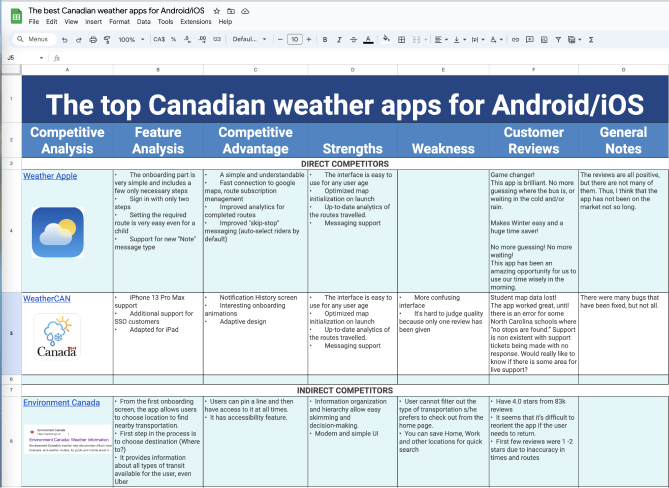
I created a data analysis Excel sheet to gain a clear understanding of the process of extracting insights from data to make better business decisions. Identified and collected the necessary data. Sorted, analyzed and interpreted the results of the analysis.
Created User Interview Transcript with the following questions:As a result I’ve got a clear Competitive Analysis data with:
- Feature Analysis
- Competitive Advantage
- Strengths
- Weakness
- Customer Reviews
- + Additional notes
Define Phase
| Proto Persona
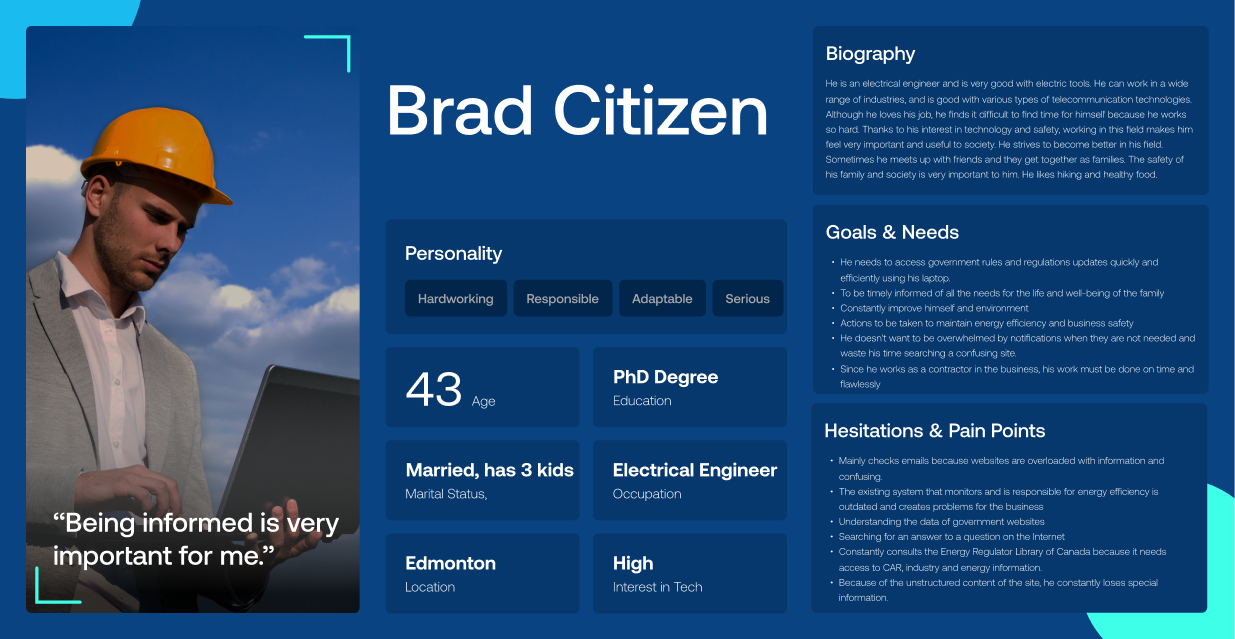
Created a Proto Persona
After collecting all existing customer data, I described their needs and pain points. Additionally, I mapped out the ideal experience and told our personality story.
Ideate Phase
| User Journey
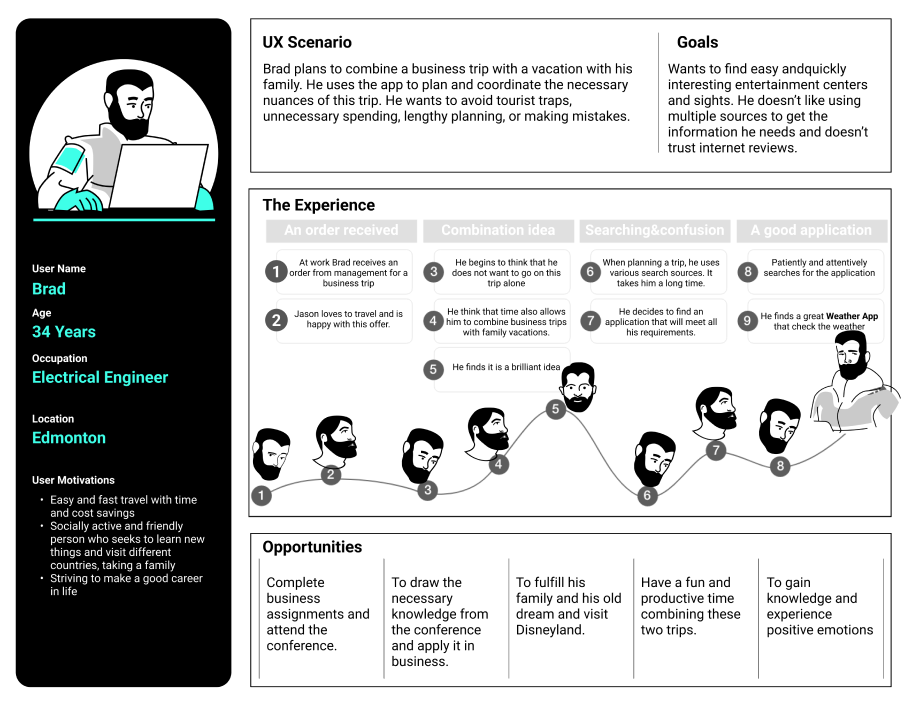
By creating storyboards we visually conveyed the feeling of experience and some sequence, a user journey map was all about the total sequence and refining the details of the user’s journey.
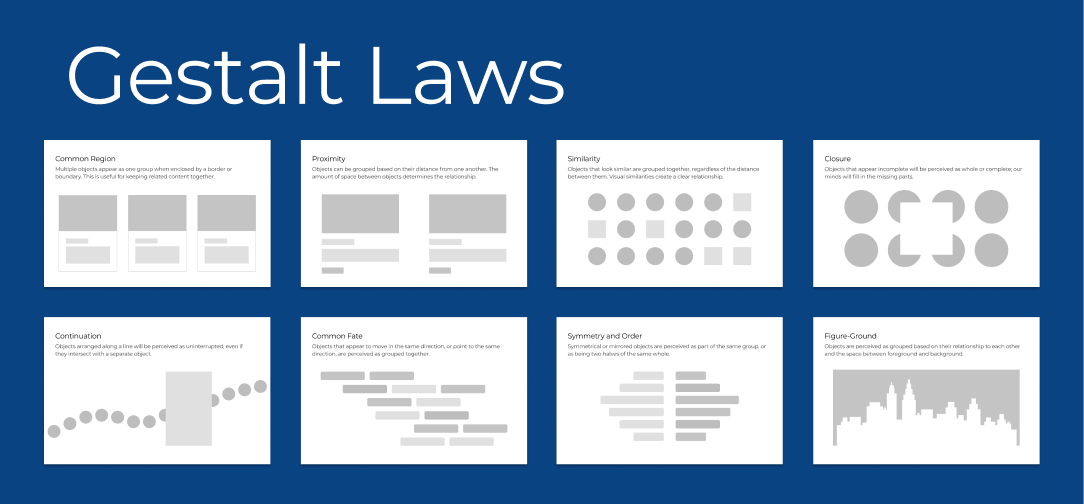
Because of the Gestalt Laws are critical in UX design, especially in interfaces, give our users a clear understanding of what they see and easily find what they want at a glance.
During the design thinking process, we organized our components in the wireframes by similarity, continuation, closure, proximity, figure/ground, and symmetry & order.
Prototype Phase
| Micro-interactions
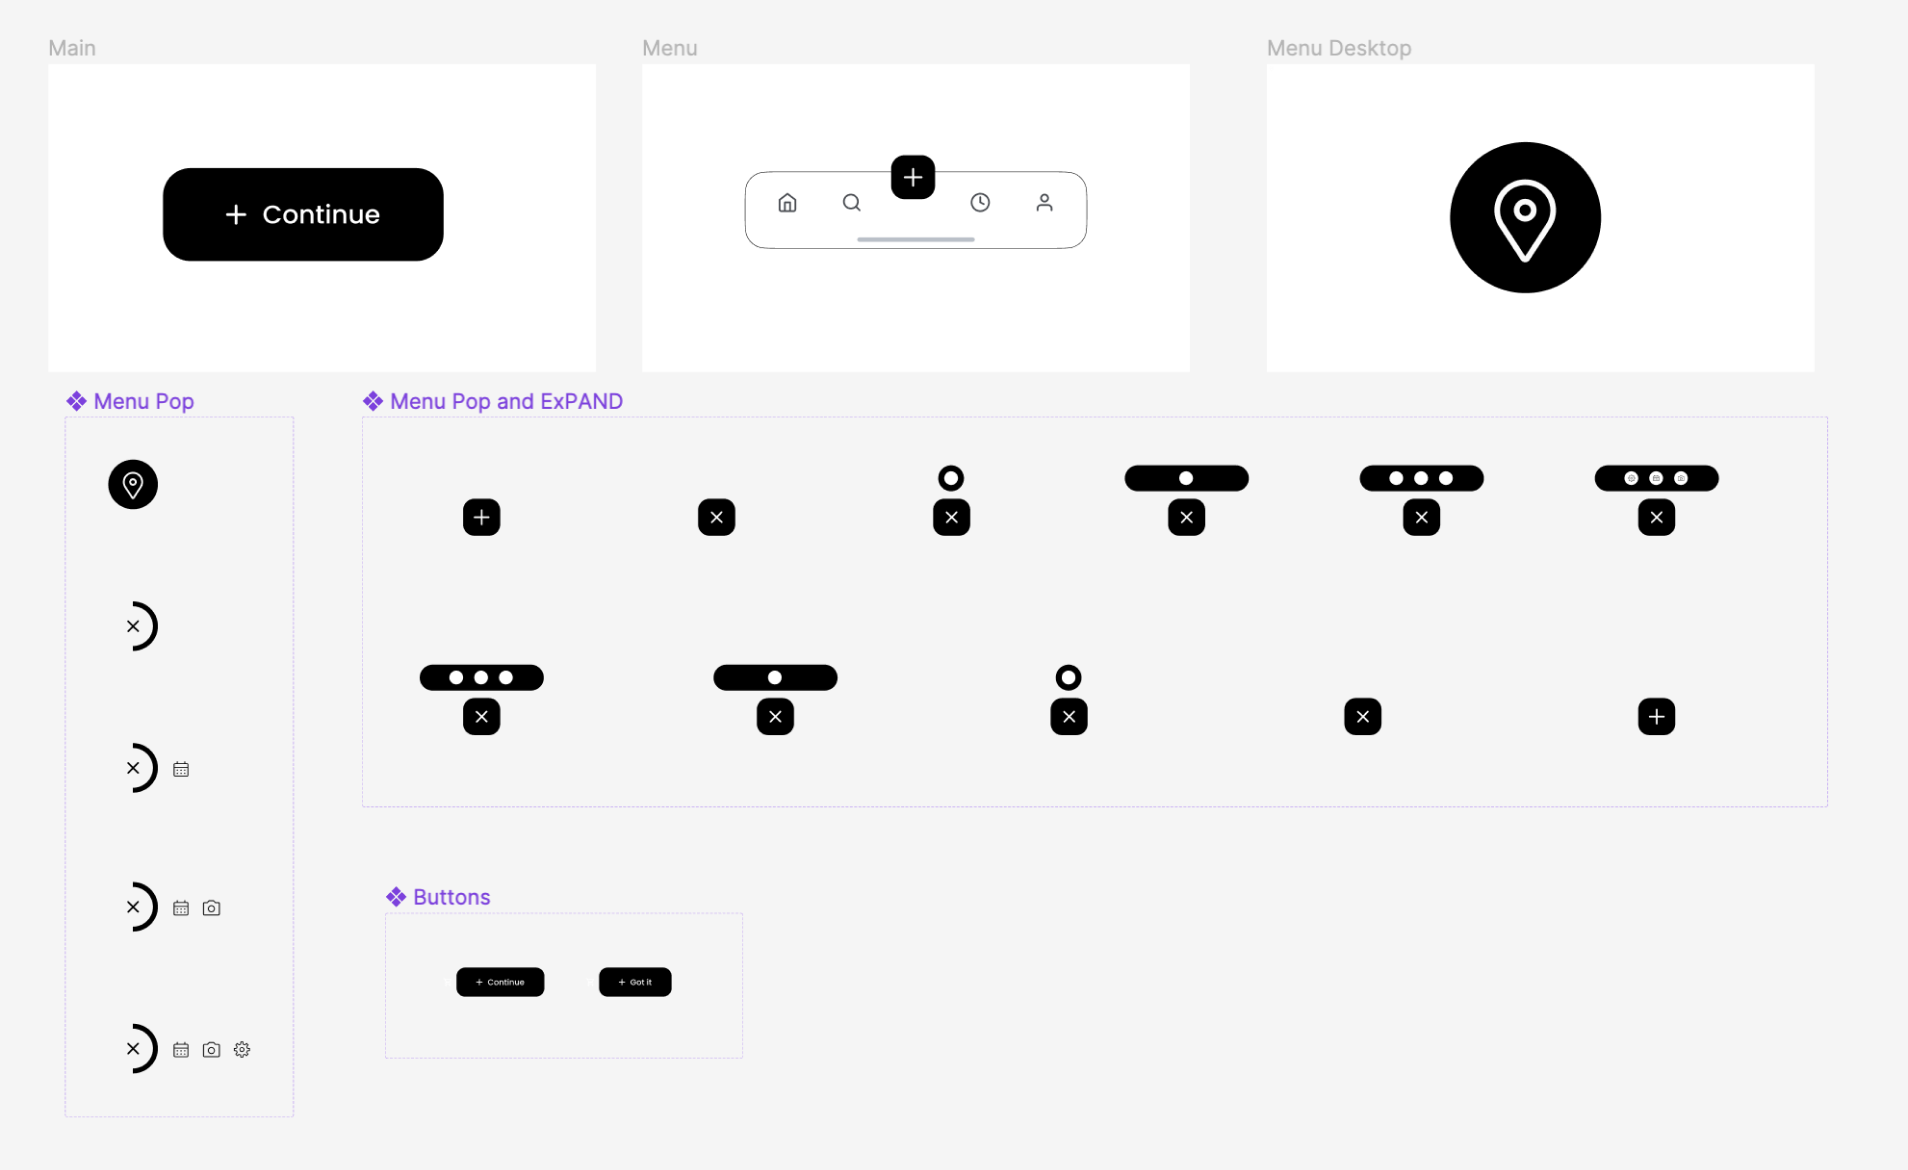
I’ve worked on some micro-interactions that are preferably functional animations that would support the user by providing visual feedback and showing changes more clearly.
| Wireframes, high-fidelity design and mockups
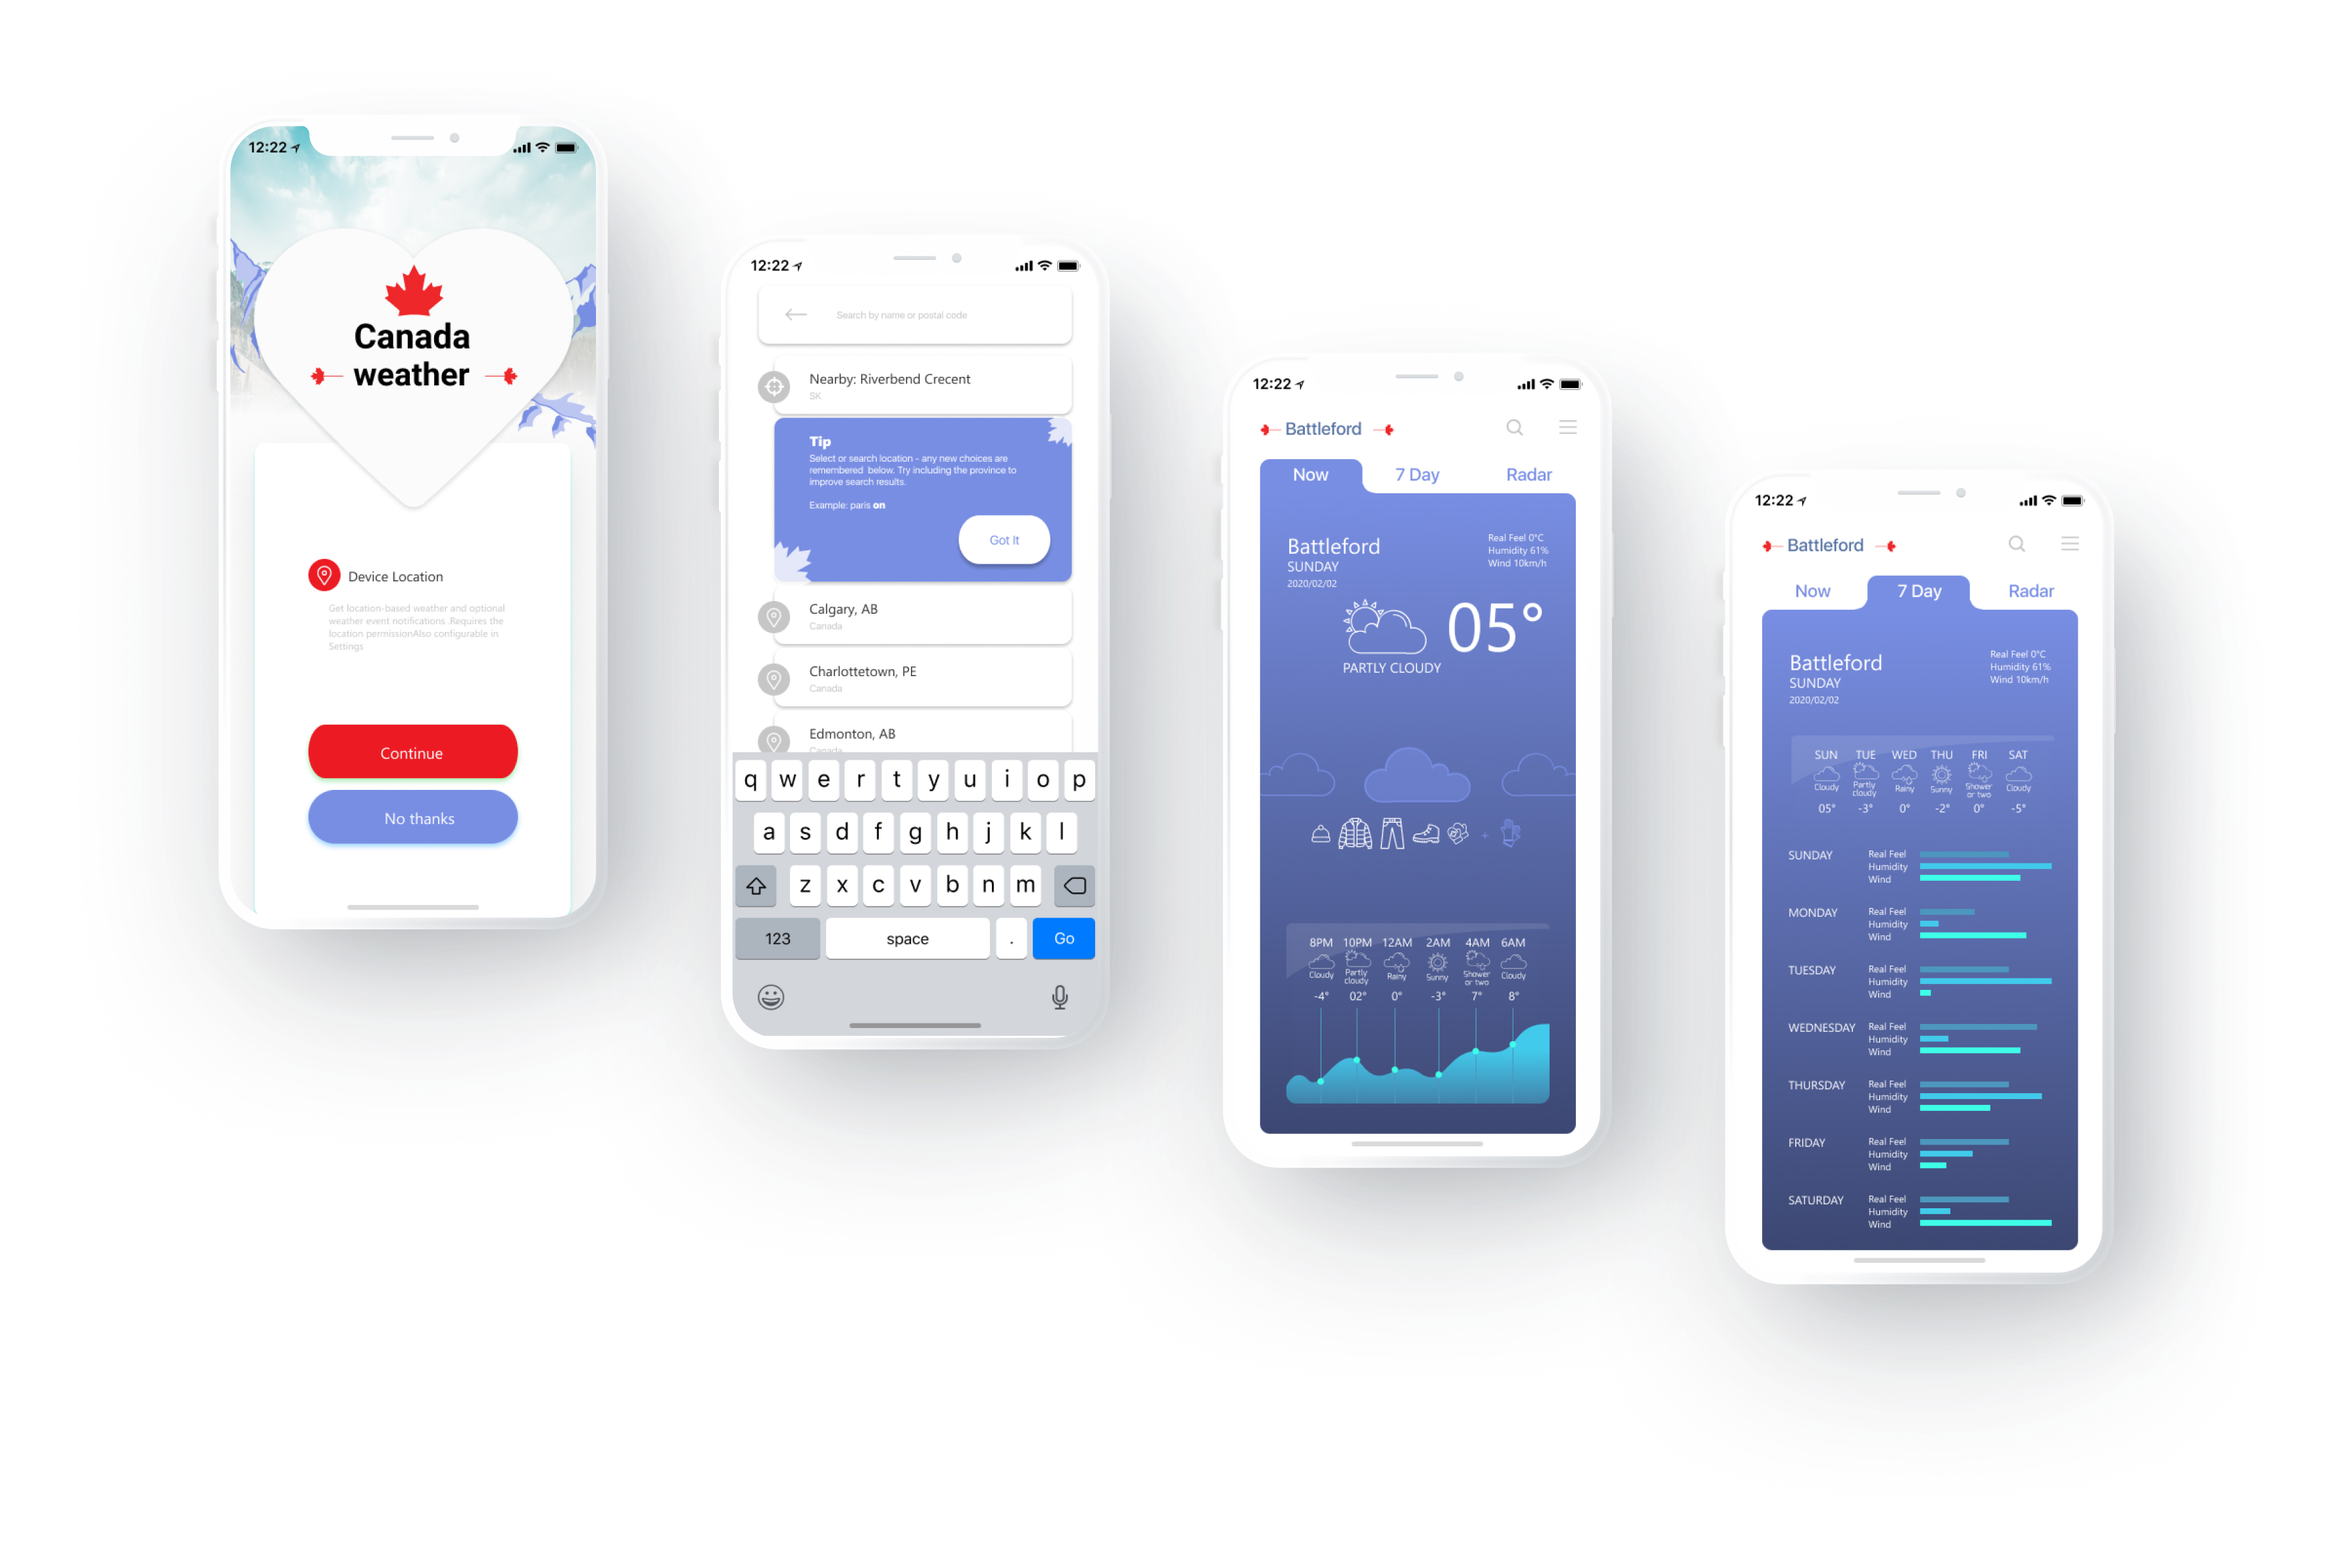
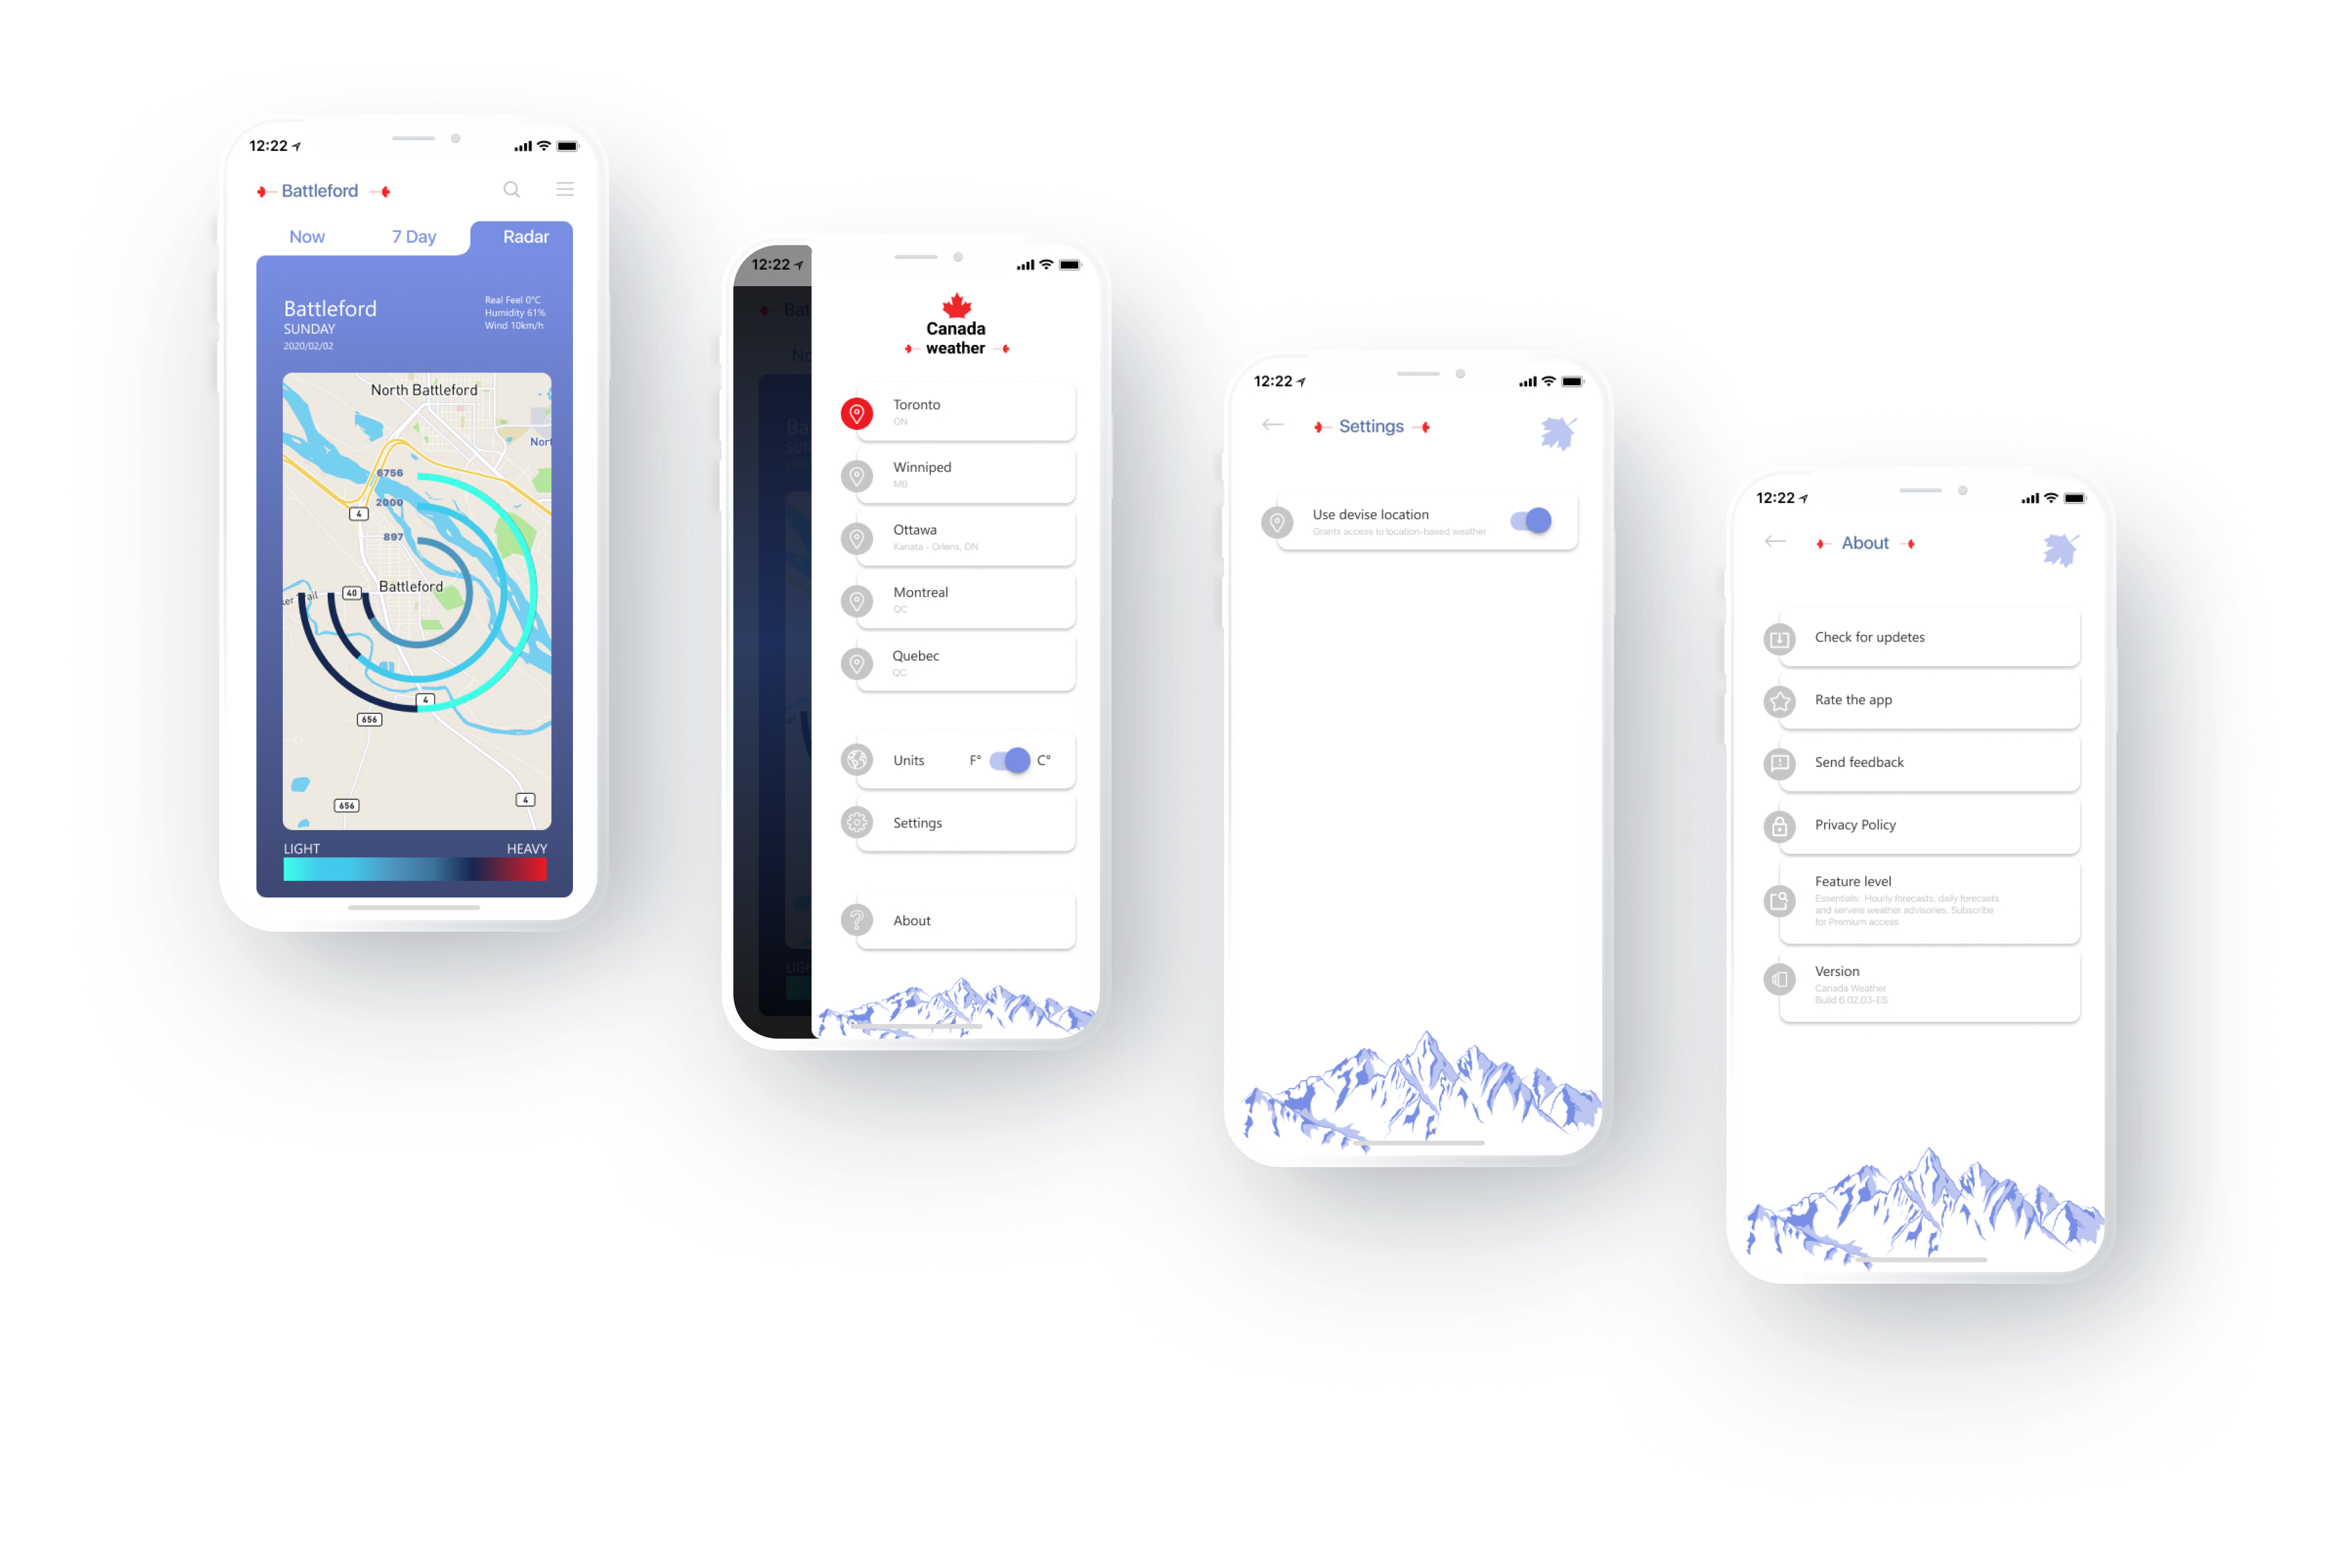
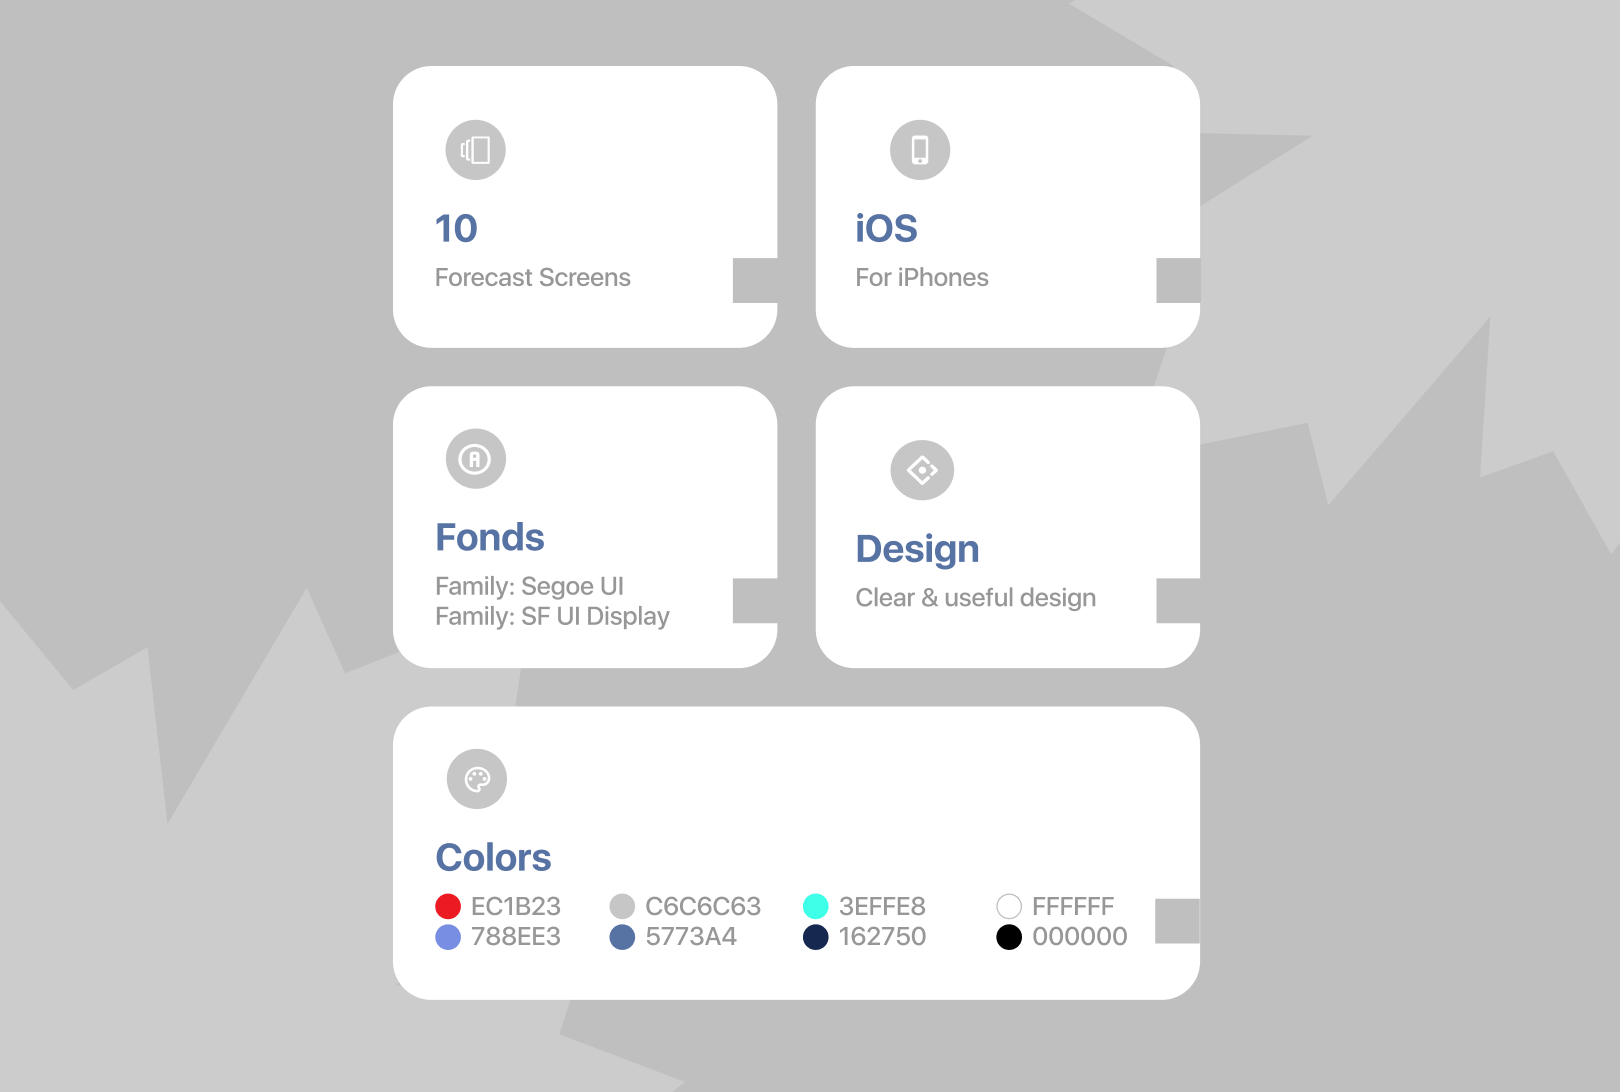
Designed wireframes to our app and high-fidelity prototype with the features below:
Current conditions, 24-hour forecast and 7-day forecasts for location in Canada
Weather radar widget and weather widget with clock and functional up-to-date interface in attractable UI style.
Weather map: High-resolution radar animation on a zoomable map background and short-range forecast widget for quick, at-a-glance weather information.
|Usability testing, A/B testing
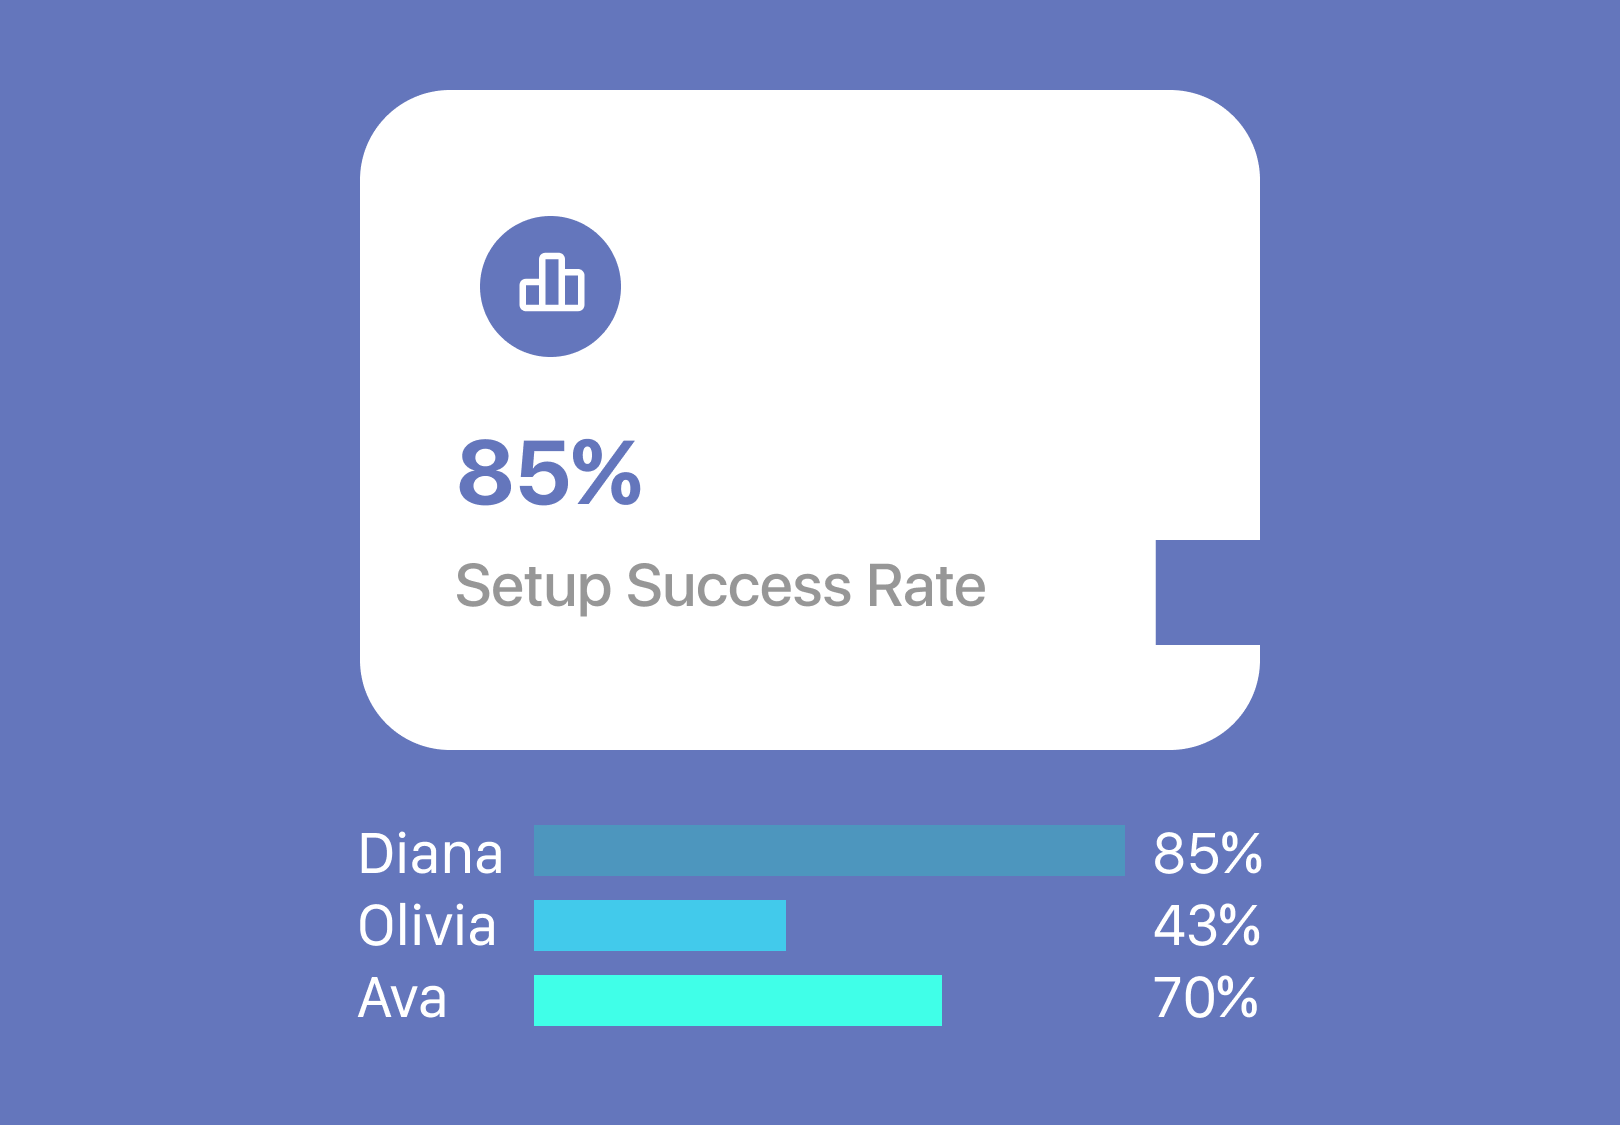
Two variants of a page were shown to users at random, and statistical analysis was used to determine which variation performs better for a given conversion goal.
My option was preferable for users with an 85% success ratio
