Mission
School bus delays are a reality and affect many parents and students in today’s society.
Surprisingly in the Toronto GTA, there’s only have one way to check the status of bus delays – the school bus website – which by the way is cumbersome, outdated and unresponsive. It was important to create an app for improving the school bus experience.
Problem
We have observed that parents and children encounter uncertainties around the bus schedules and delays, which is causing frustrations surrounding long wait times for children in unfavourable weather and added stress to parents by causing scheduling disruptions to their day.
We were tempted to redesign the website but chose to design a mobile app instead.
Why? Because our quantitative research shows that 94% of our users use their phones in the morning and if they could access this information quickly and easily, it would make for a better user experience!
The choice was easy.
Collaborators
Shaza Mezian, Diego Fuchs, Charmaine Foon, and Diana Hamilton
My Role
Research > Design Thinking > Problem Definition > Ideation > Early Prototyping
- Project plan creation
- Competitor Analysis
- Affinity Diagram
Prototyping > Testing > Low-Fidelity Prototype Iteration > Testing
- Defined problem statement
- Conducted a competitor analysis
- Brainstorm Solutions (I Like, I Wish, What If)
- UI Inspiration
- Design Low-Fidelity Wireframes
- Usability Testing
- UI Style Guide Design
- High-Fidelity Clickable Prototype
Design Thinking Process
In the design thinking process, our problem-solving methodology was focused on the users of the system (parents and kids) to have a more structured, convenient, and safe way to track the route of a school bus.
Our process involved 5 phases: Research, Define, Ideate, Prototype and Test.
The Research Phase
The research was conducted in 2 phases:
- Phase 1 (Qualitative)
to help us understand the main pain points of users and to validate if our solution was worth pursuing - Phase 2 (Quantitative)
a Google survey with very specific questions was used to drill down further on the pain points and to provide data that could be used to measure our success.
One-on-one user interviews were conducted for qualitative research.

〉 Participants
- 2 students currently taking the school bus
- 2 sets of parents with children taking school buses
- 3 school staff members, including an ECE teacher, a school secretary and a principal, all of whom were in some way involved with managing the morning and/or afternoon bus routine.
〉 Stakeholders
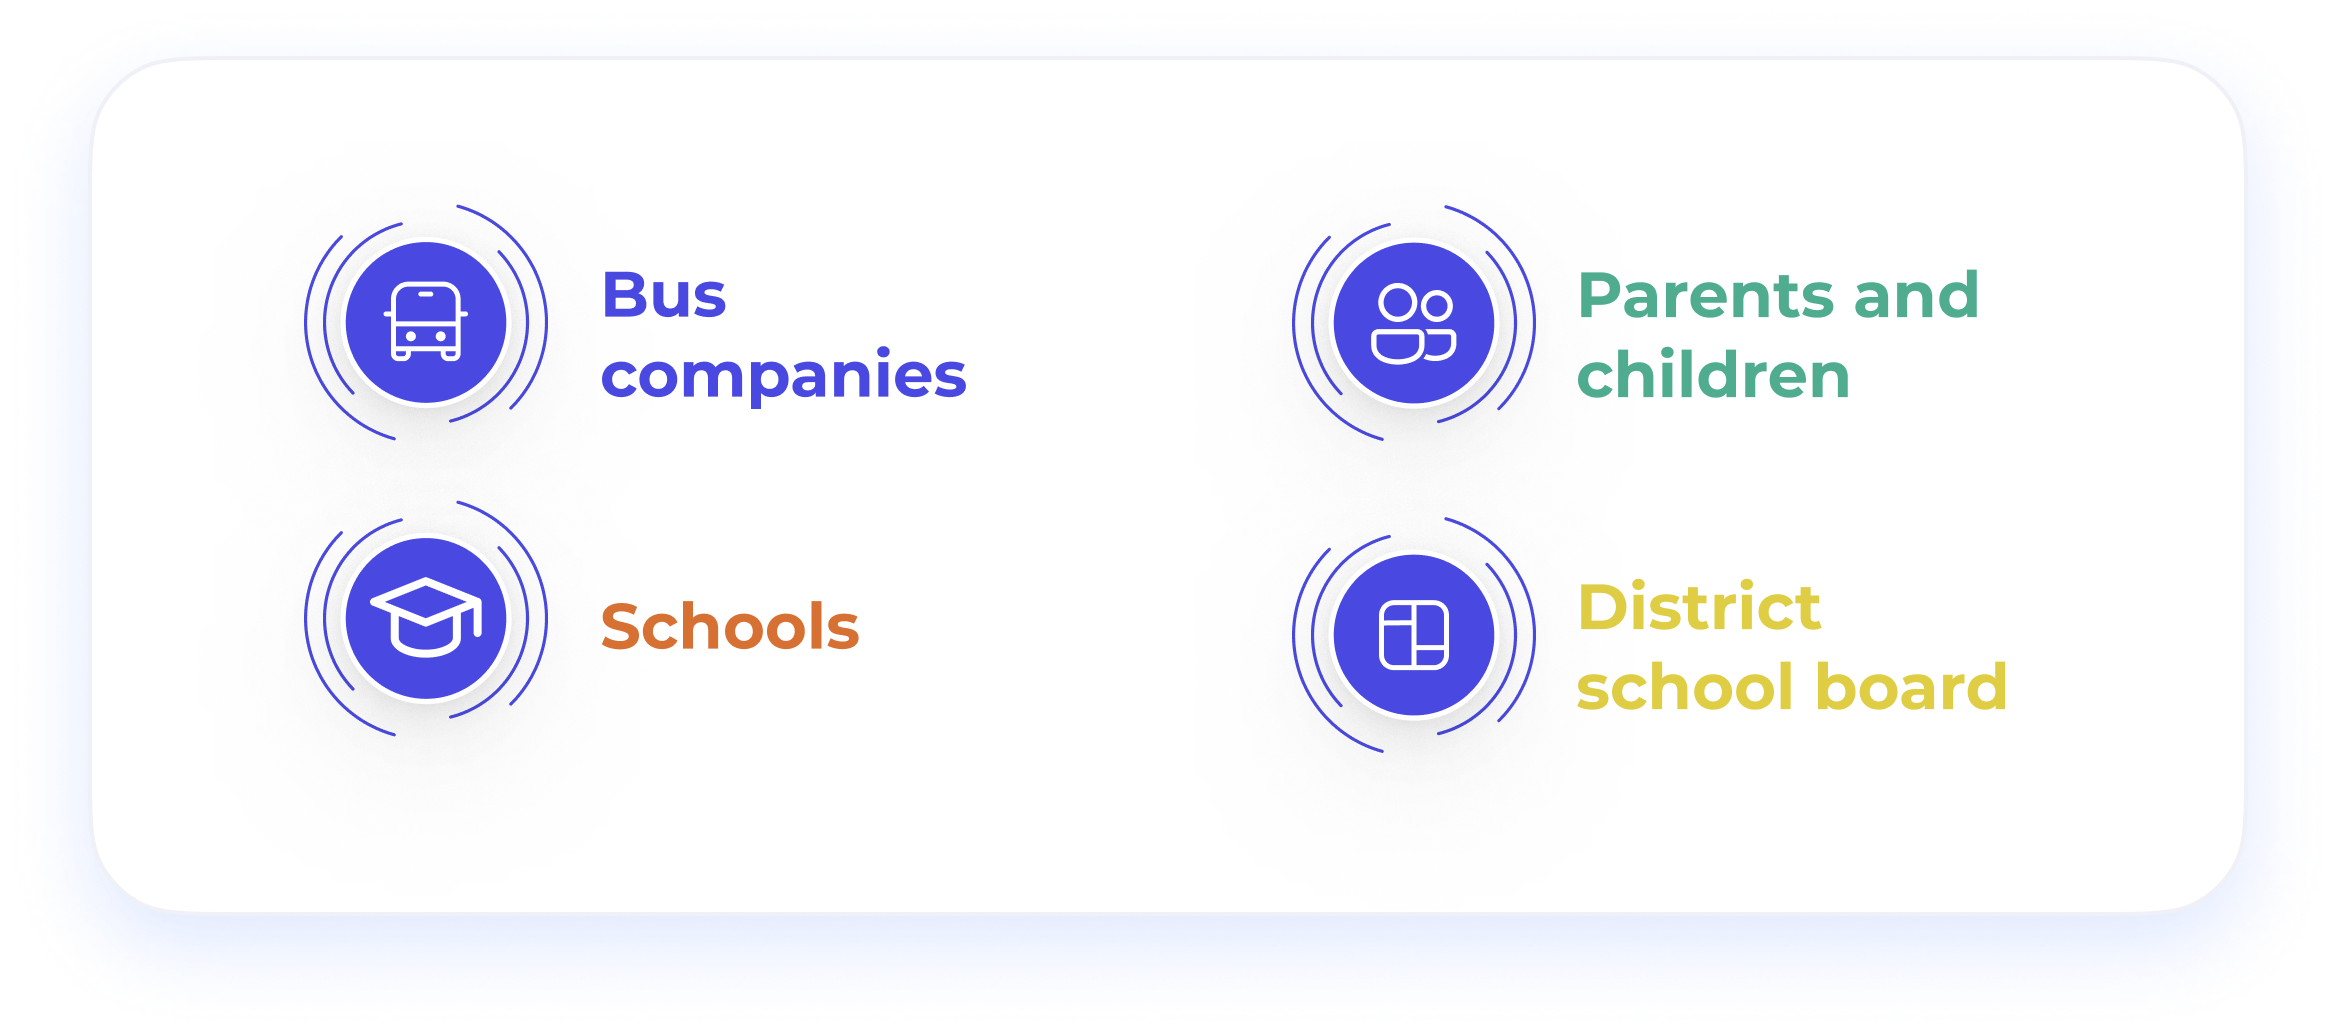
There were many stakeholders to consider:
Bus companies, schools, parents, children and the district school board.
We chose to focus on solving for parents and children and developed a proto-persona for each.
While thinking about our solutions, we needed to make certain assumptions, being:
- School board and bus company buy-in
- The school board would provide a budget for this app to be developed and it would be free for parents and their children to use
- The app could be synced with routing software from the bus company
〉 Competitor Analysis
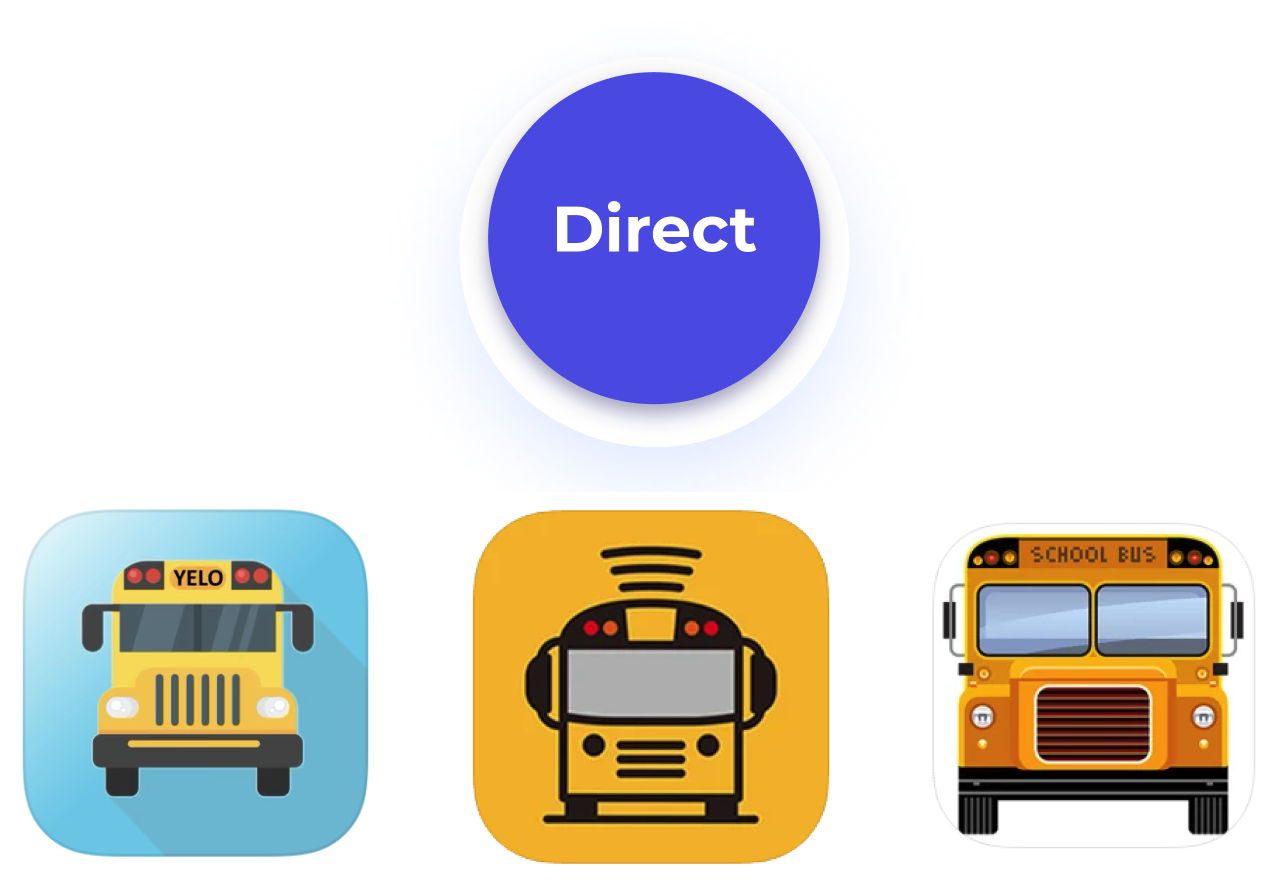
A Competitor Analysis was done to compare features and outline strengths and weaknesses. 3 direct and 3 indirect competitors were evaluated. How could we uplevel the weaknesses of some apps and use that as leverage for ours?

The Define Phase
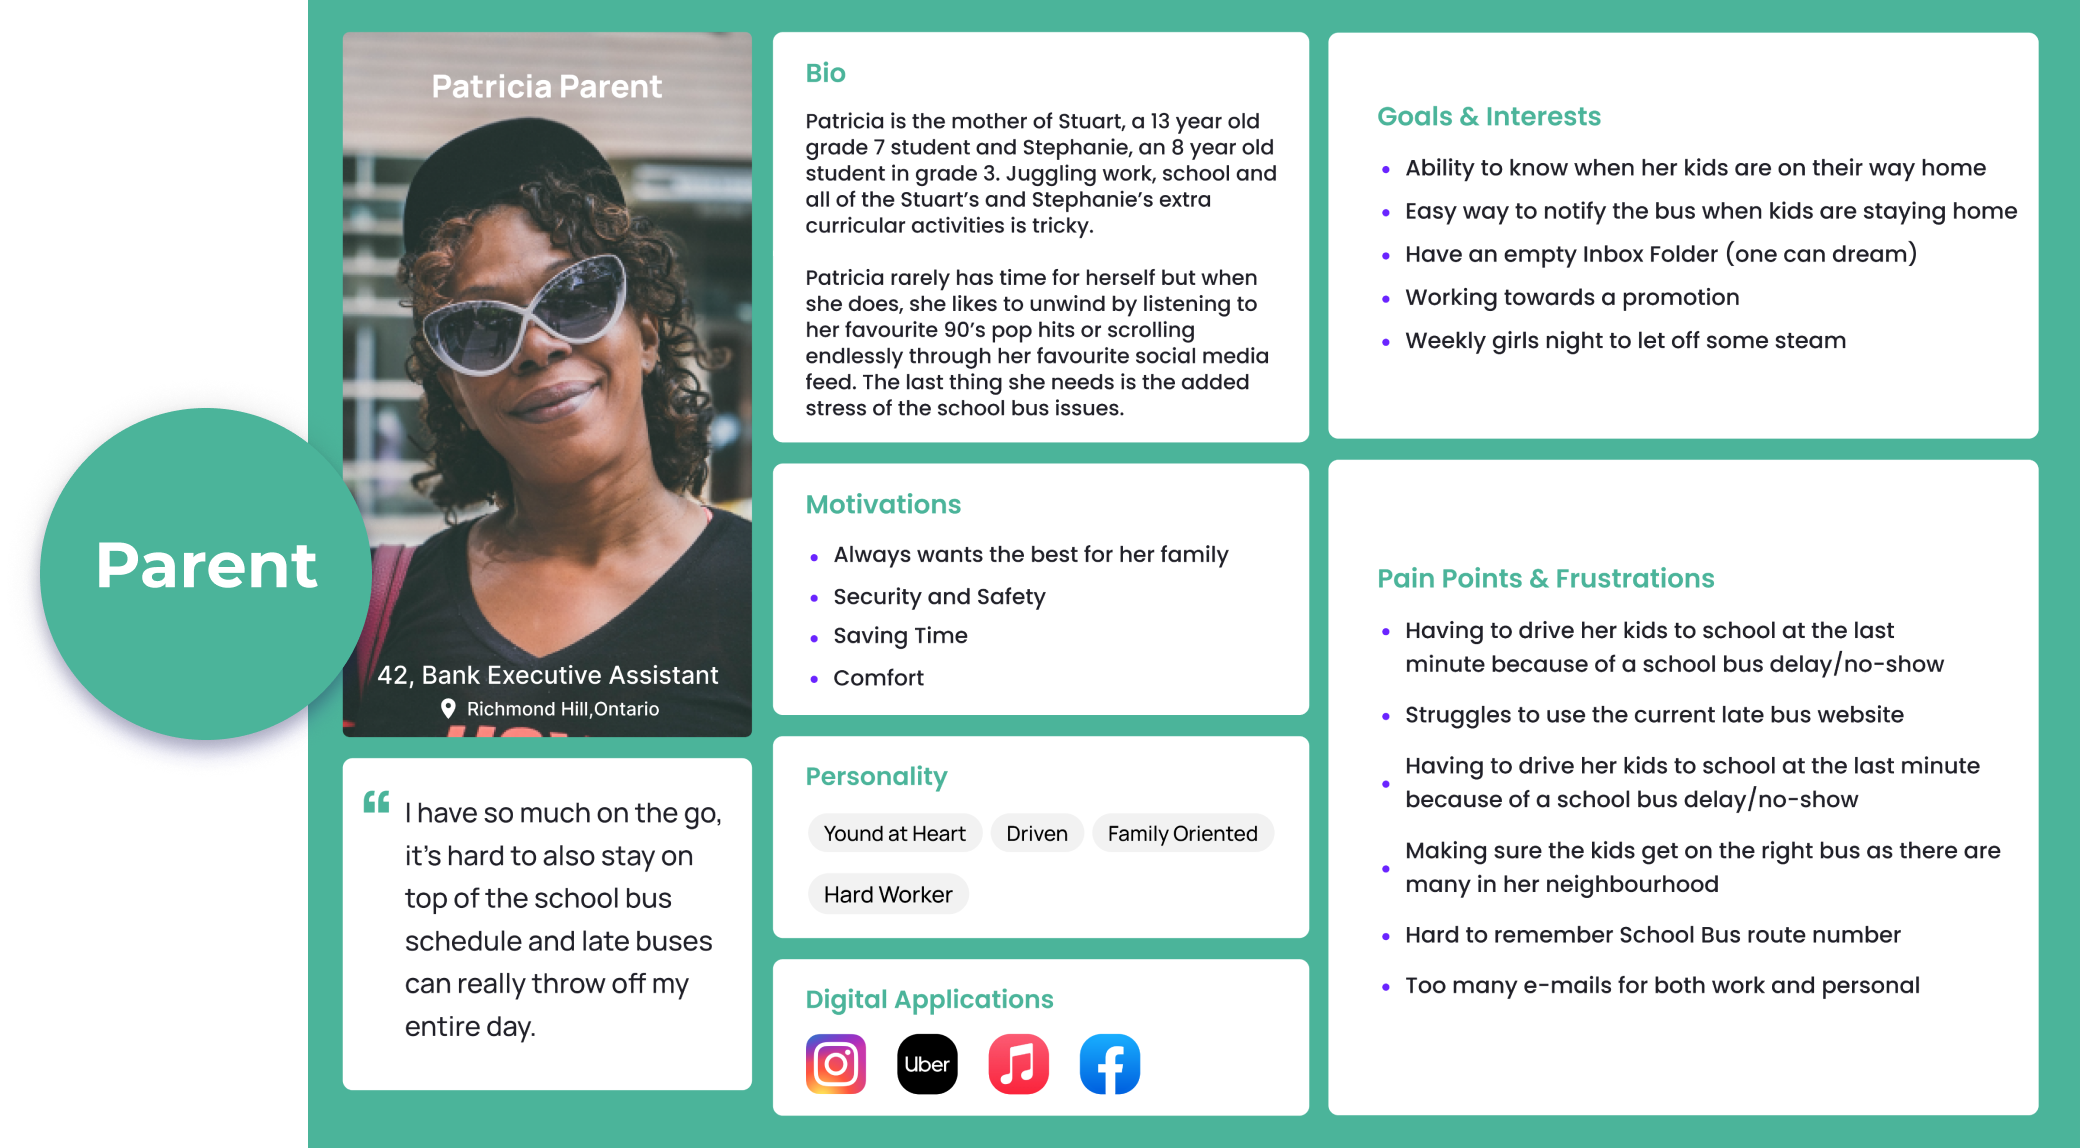
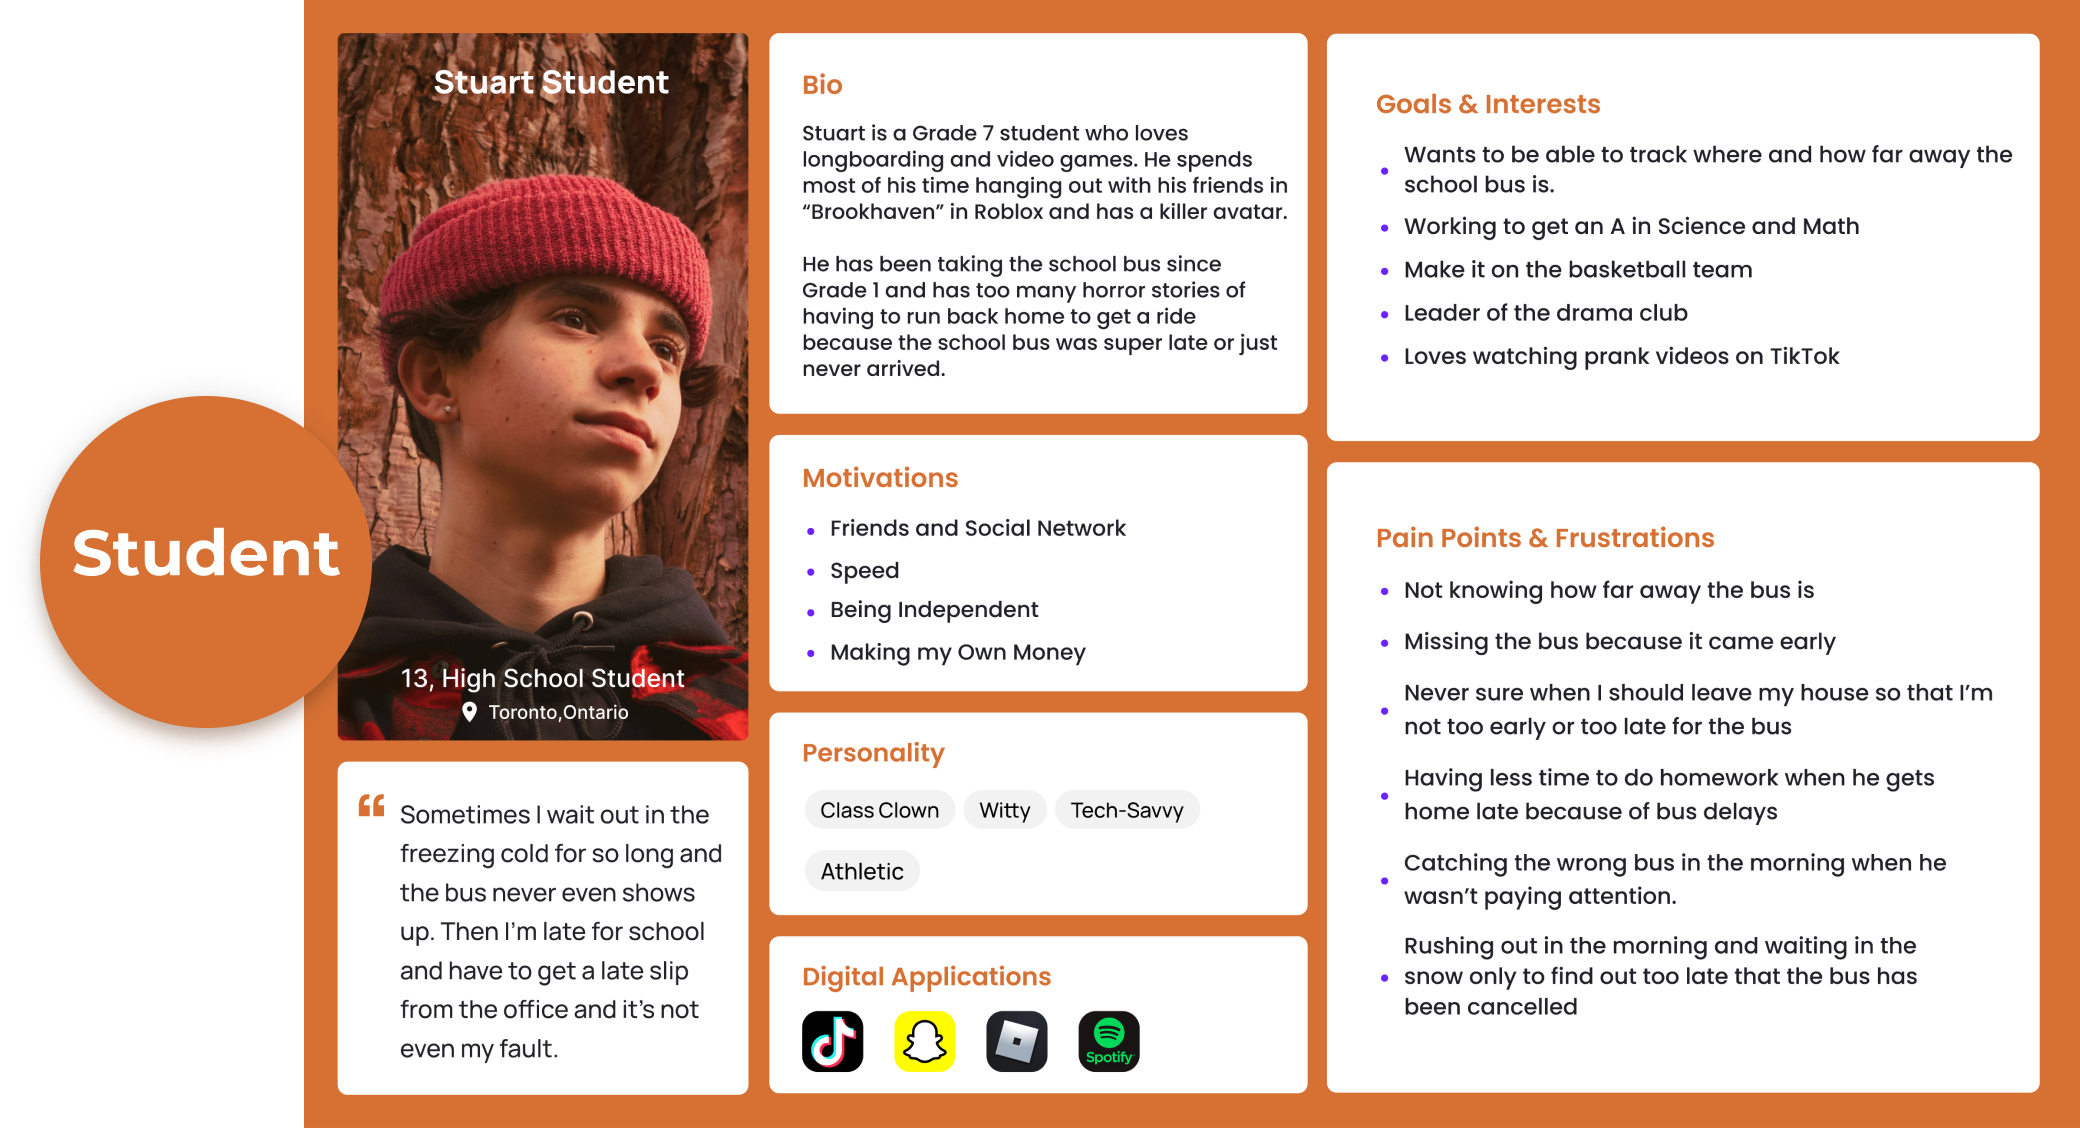
With this valuable insight, we entered the Define Phase. Our proto personas evolved into our user personas with more specific pain points. We thought of a name for our app and defined our problem statement:

Our HappyWeels App is designed to improve the school bus experience. We have observed that parents and children encounter uncertainties around the bus schedules and delays, which is causing frustrations surrounding long wait times for children in unfavourable weather and added stress to parents by causing scheduling disruptions to their day.
How might we redesign the school bus experience to keep parents better informed of updated bus schedules so that it decreases the time children spend waiting for their bus?
﹀ User Personas

The Ideate Phase
Using the I Like, I Wish, What If method, we brainstormed features for our app. It was really tough deciding on which features we wanted to focus on. There were so many we wanted to include! Our hero feature would solve countless paint points, but we also wanted to give our users the option to plan ahead by including other features, thus reducing stress and frustration on their part.
With the help of a 2 x 2 matrix, we decided to focus on 4 main features which would address most of the pain points and which were high impact and low complexity.
- Website information is not reliable
- Parents and children can’t always remember their bus route numbers
- Bus delays and cancellations are not timely and consistent
- Inaccurate bus delay estimates
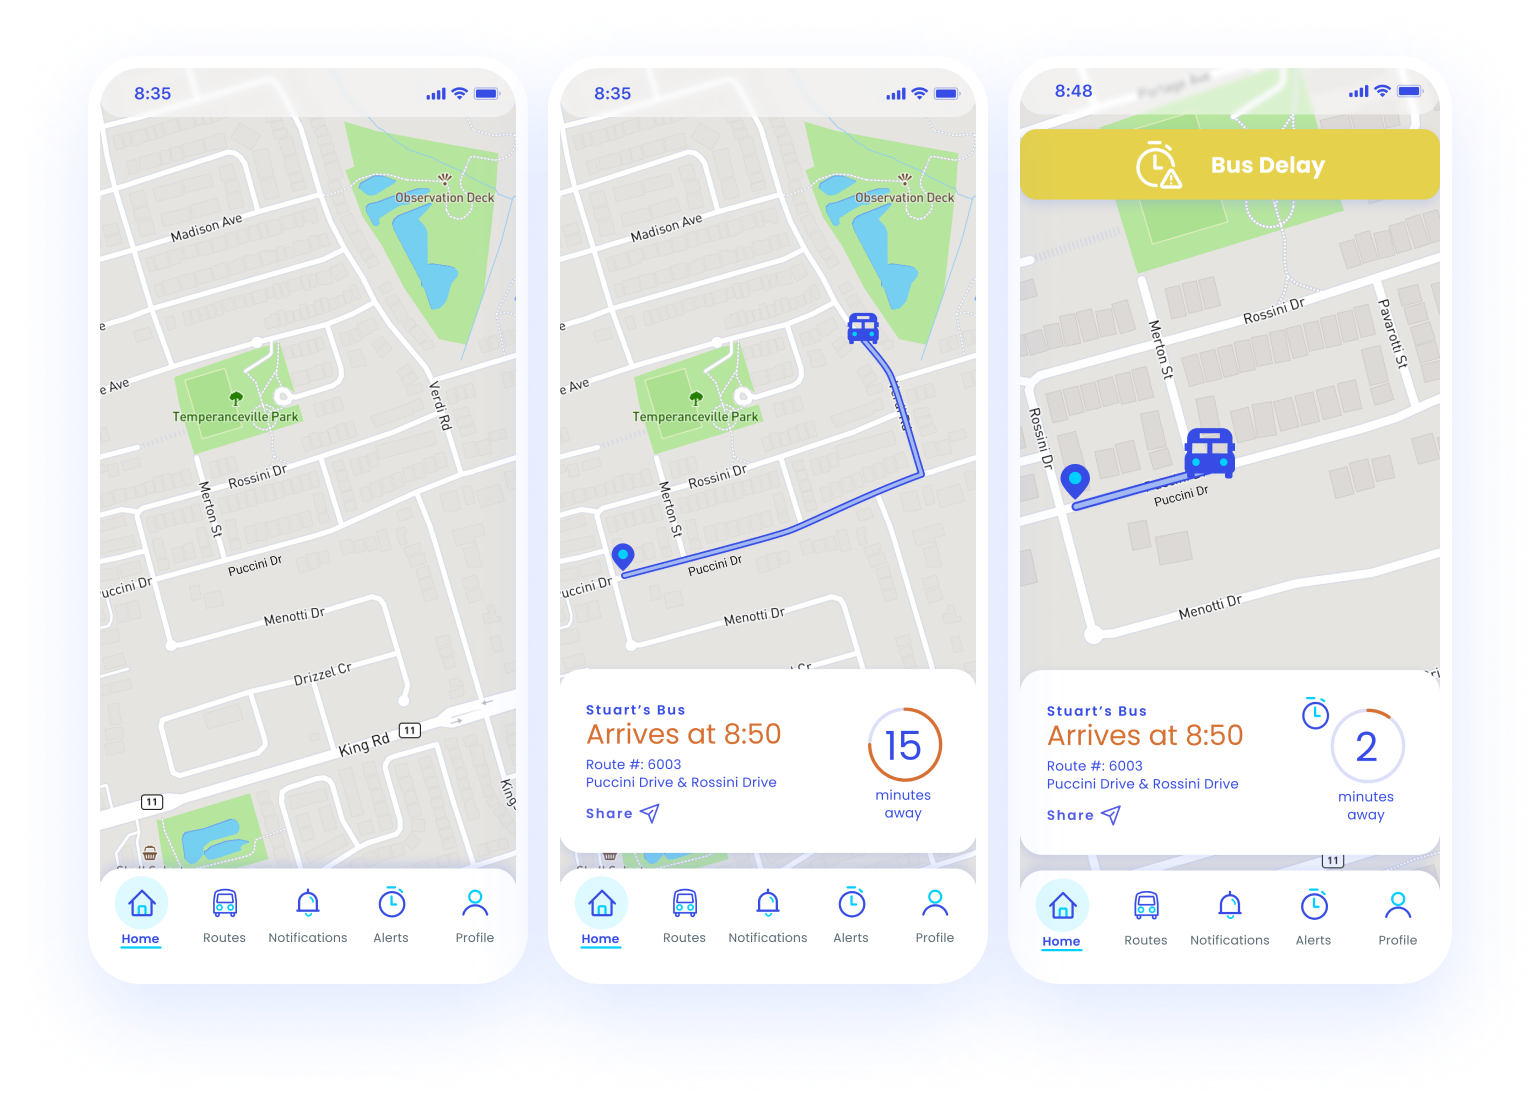
Feature 1: REAL-TIME TRACKING
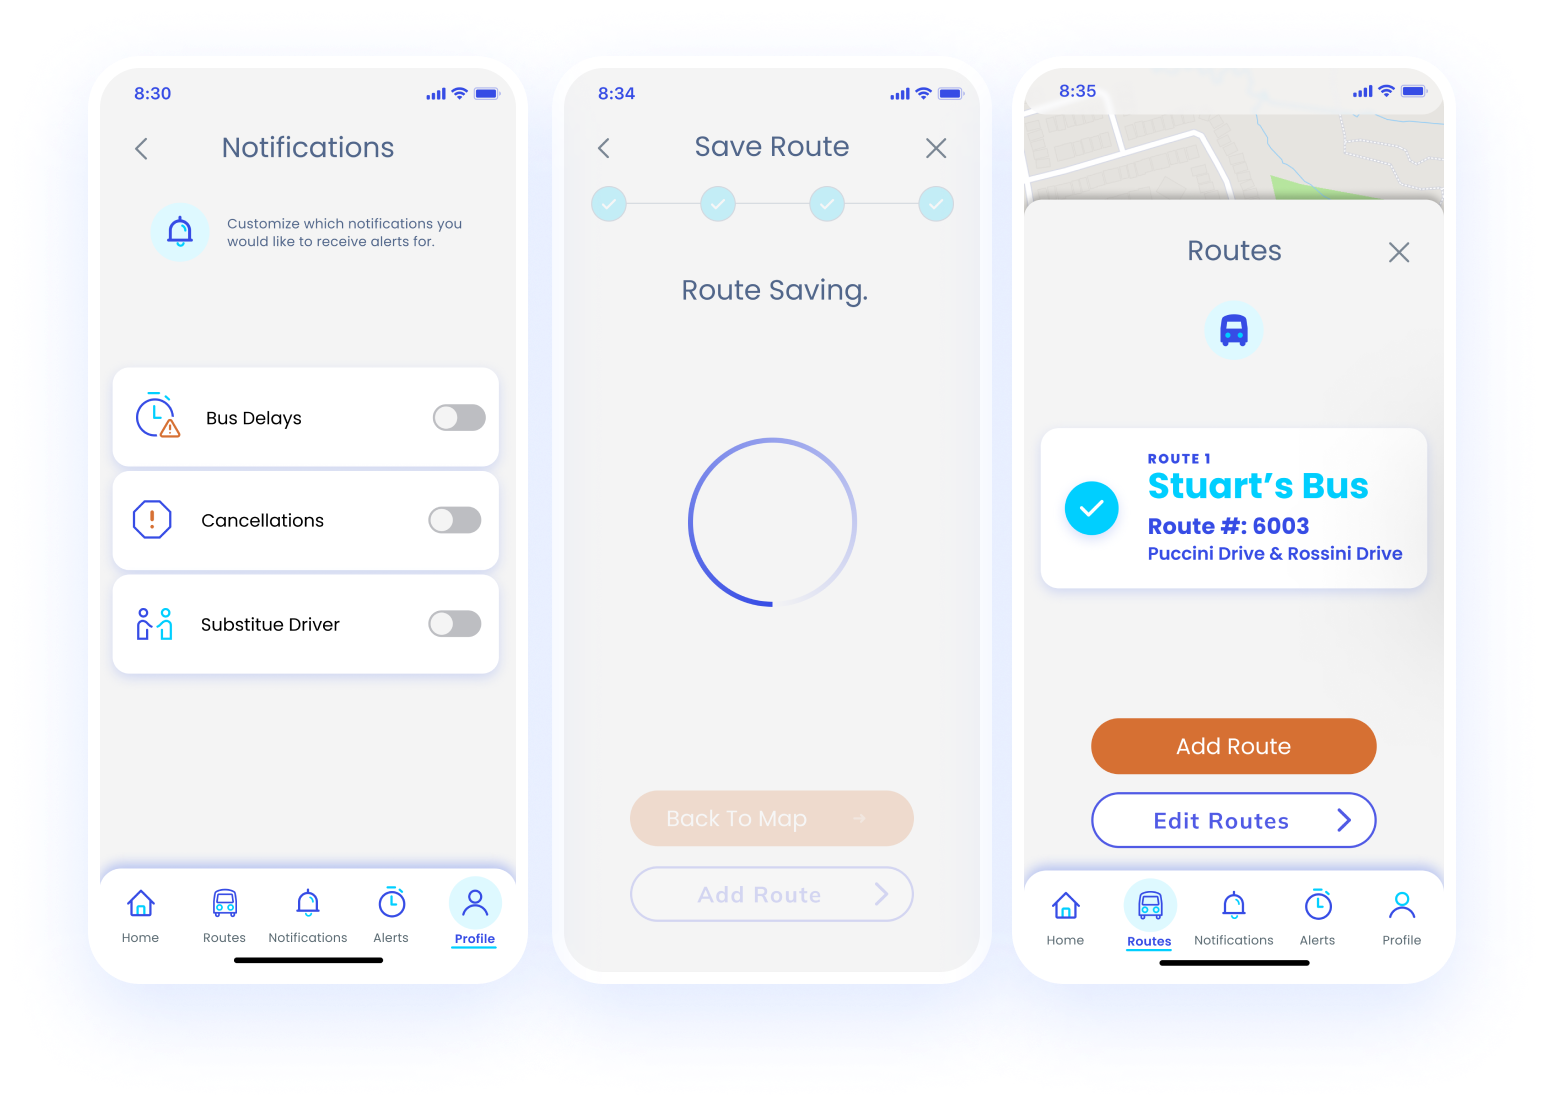
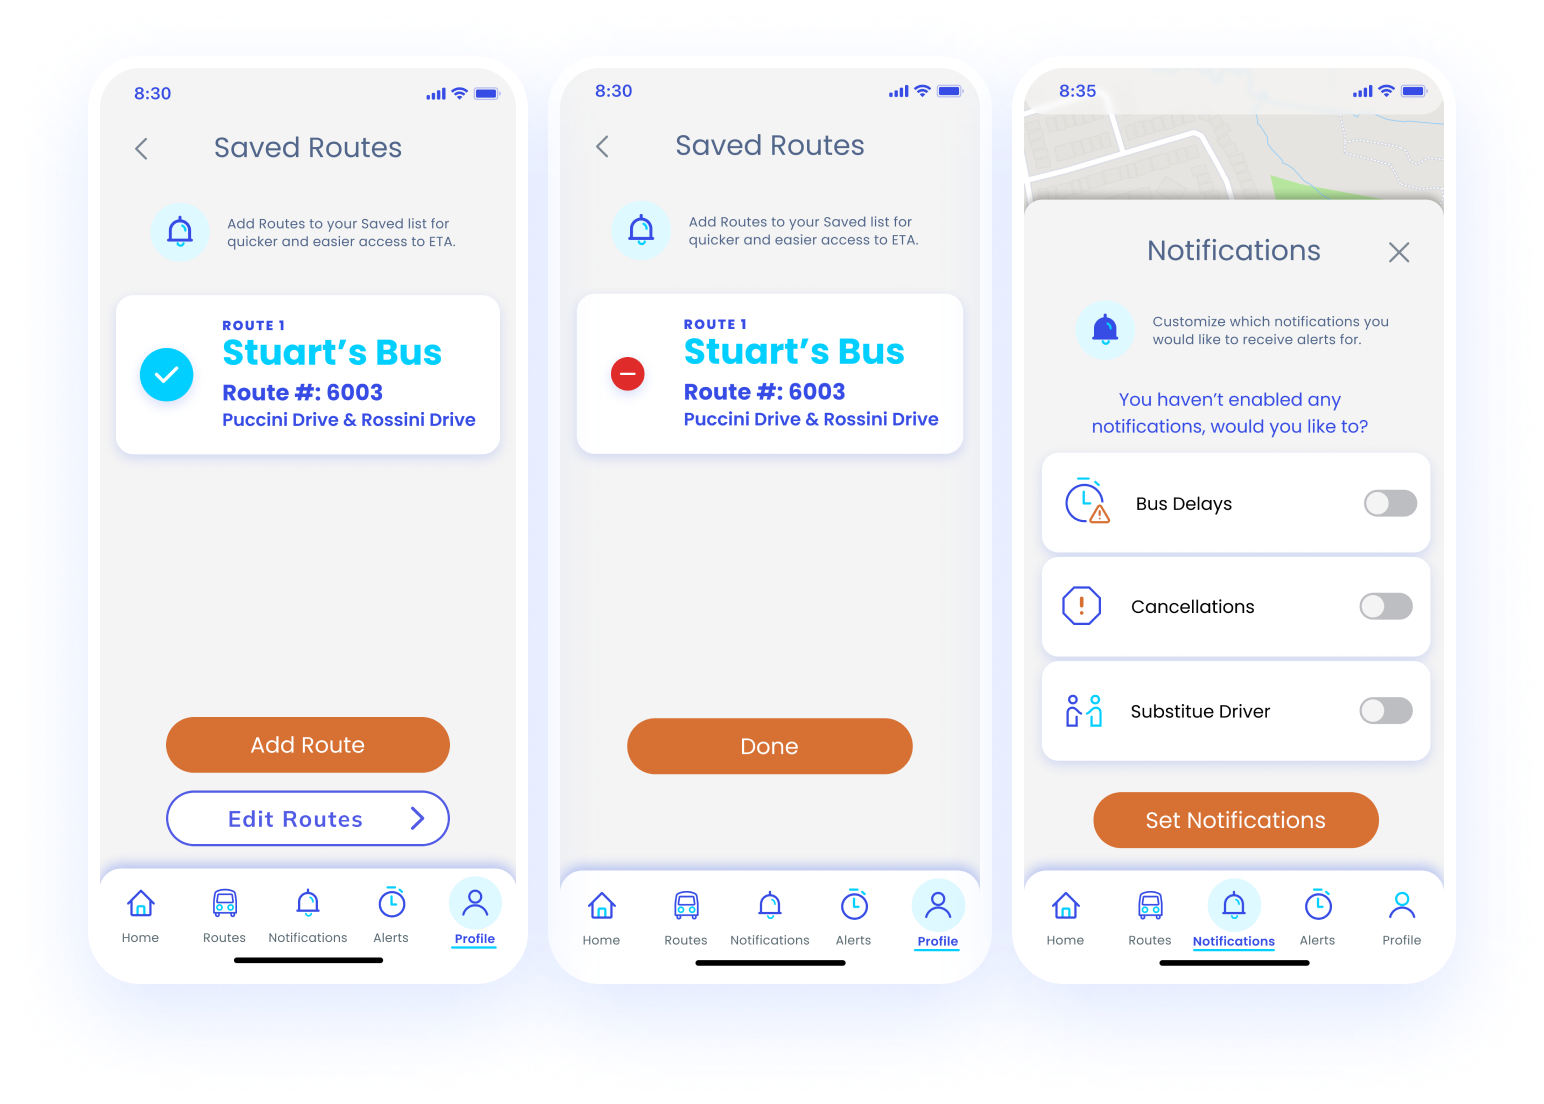
Feature 2: SAVE and SHARE ROUTES
Feature 3: Set CUSTOM NOTIFICATIONS
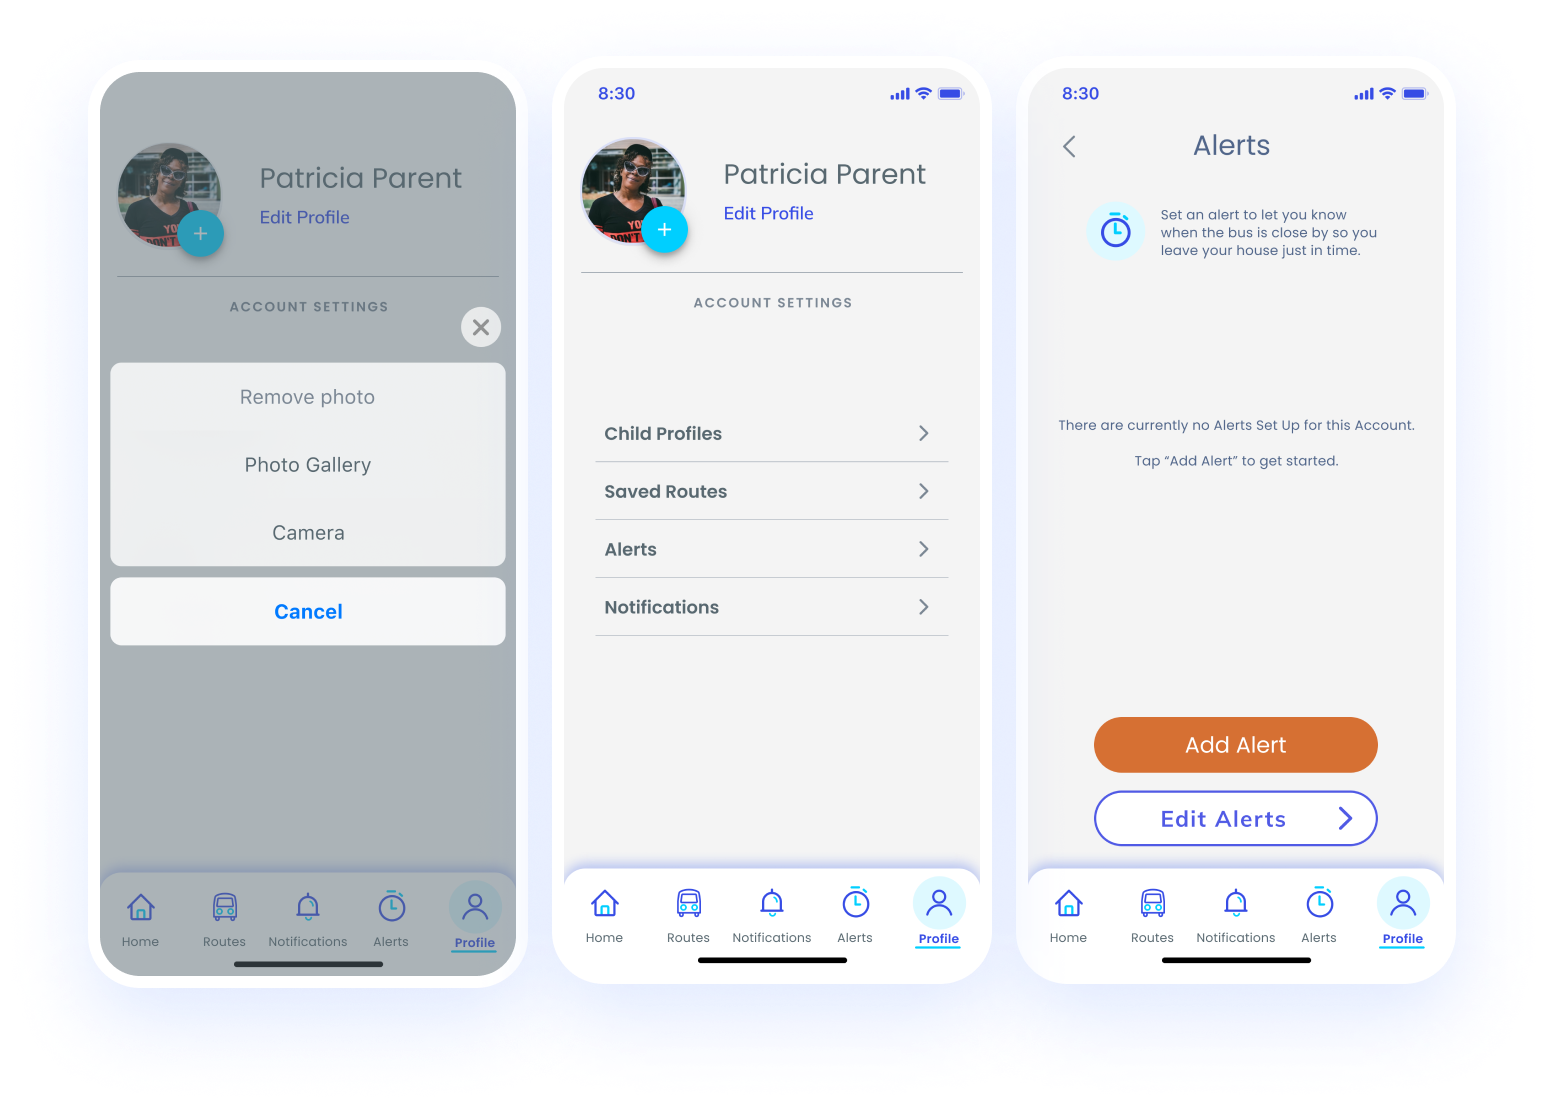
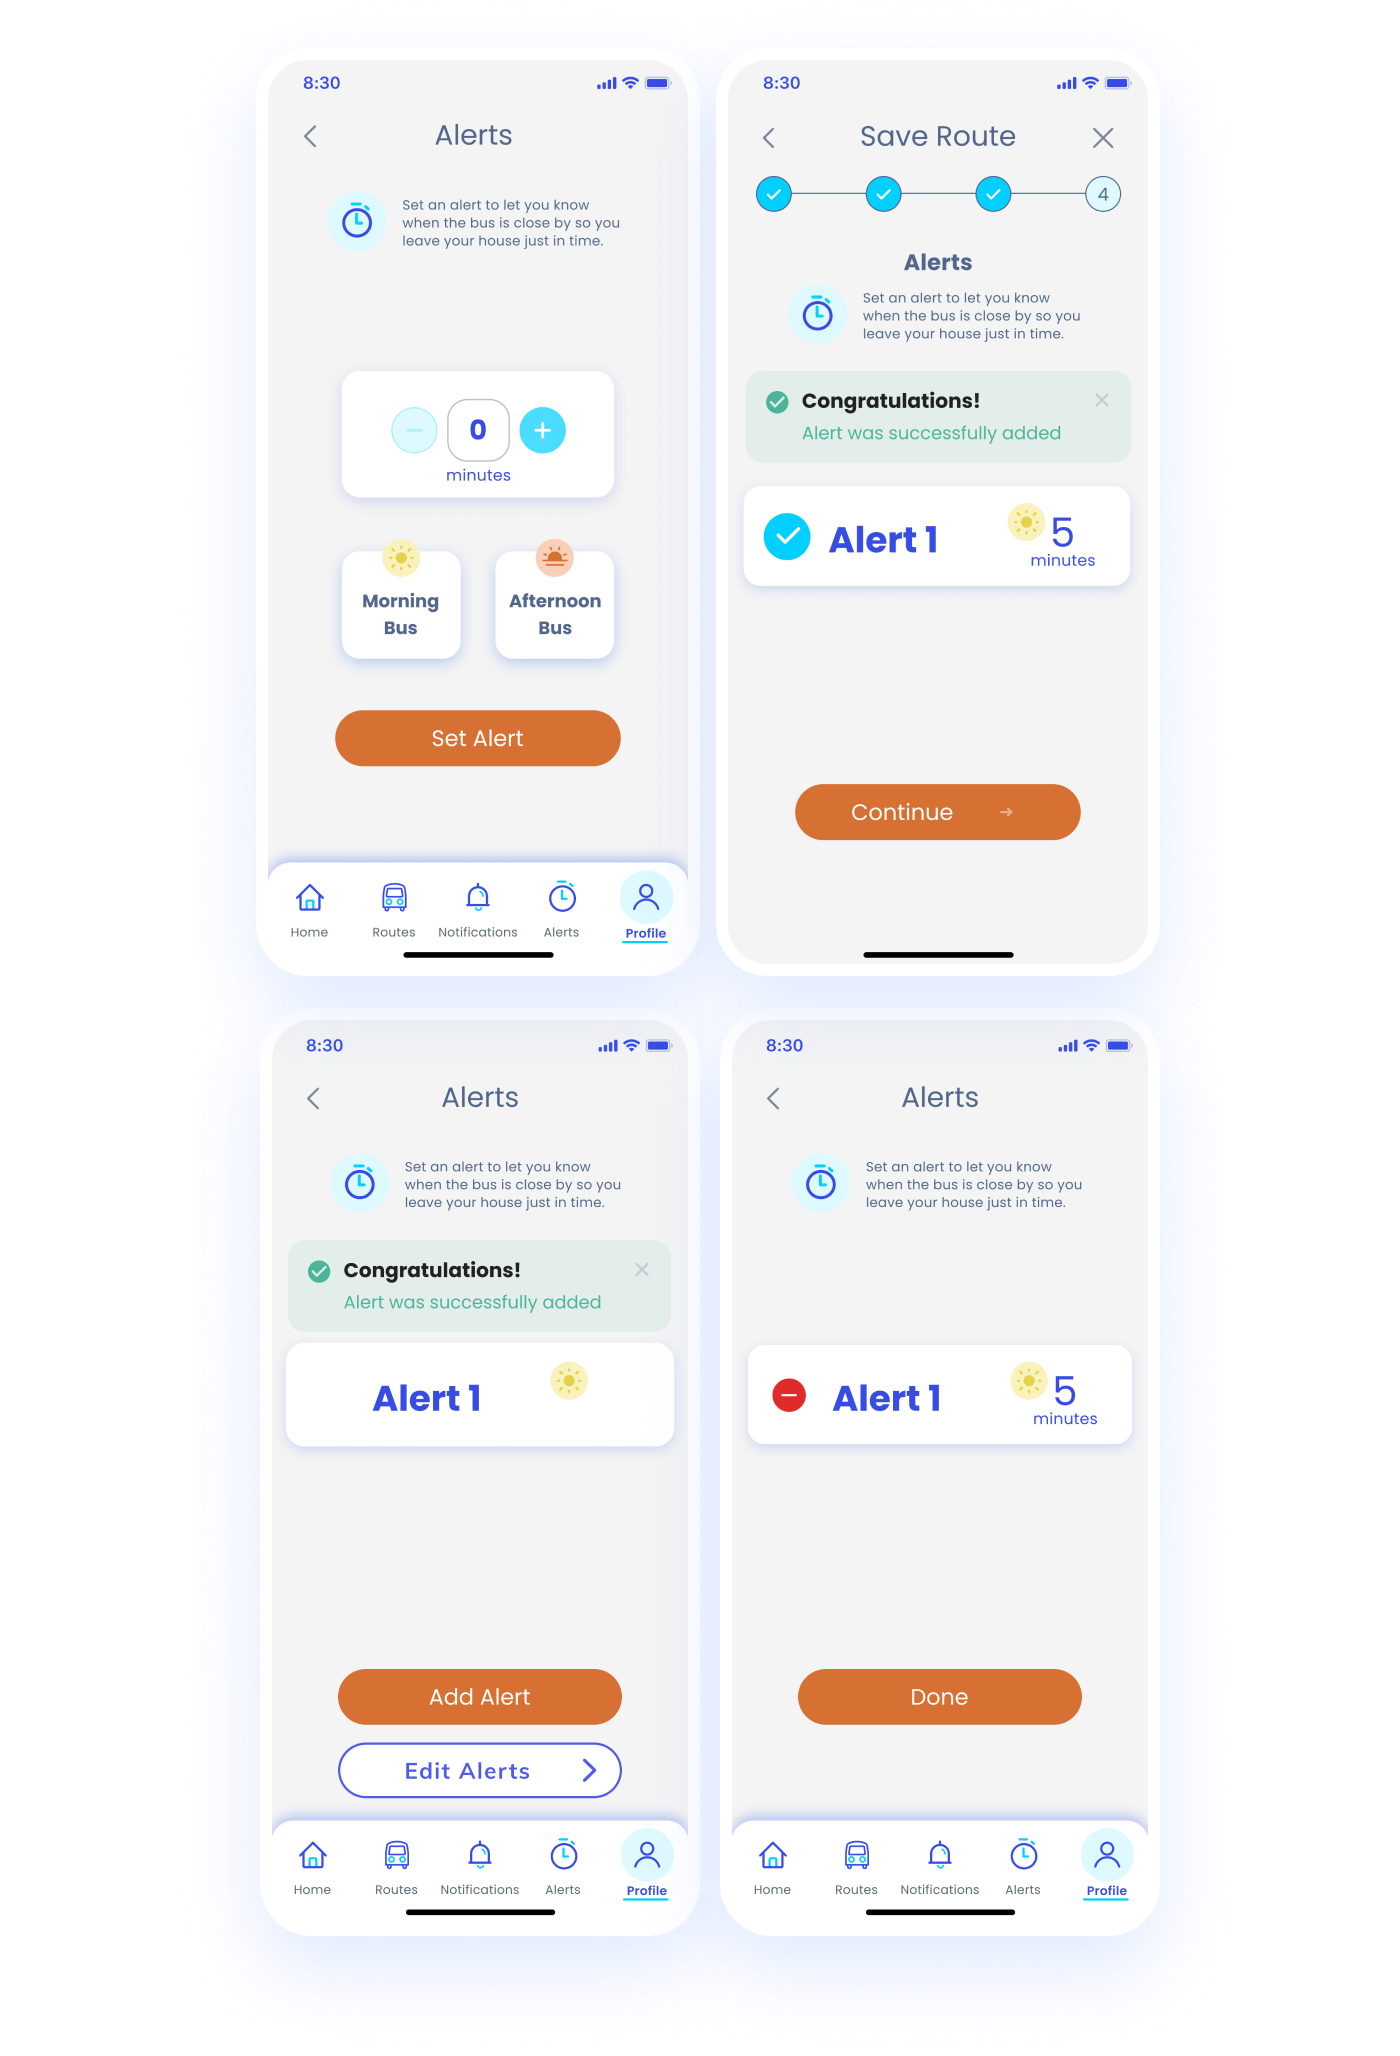
Feature 4: Set CUSTOM ALERTS
Our Value Proposition Chart ensured we were aligning our features with user pain points
We also created a User Journey Map, to help us visualize a day in the life of our user, as well as empathize with their challenges.


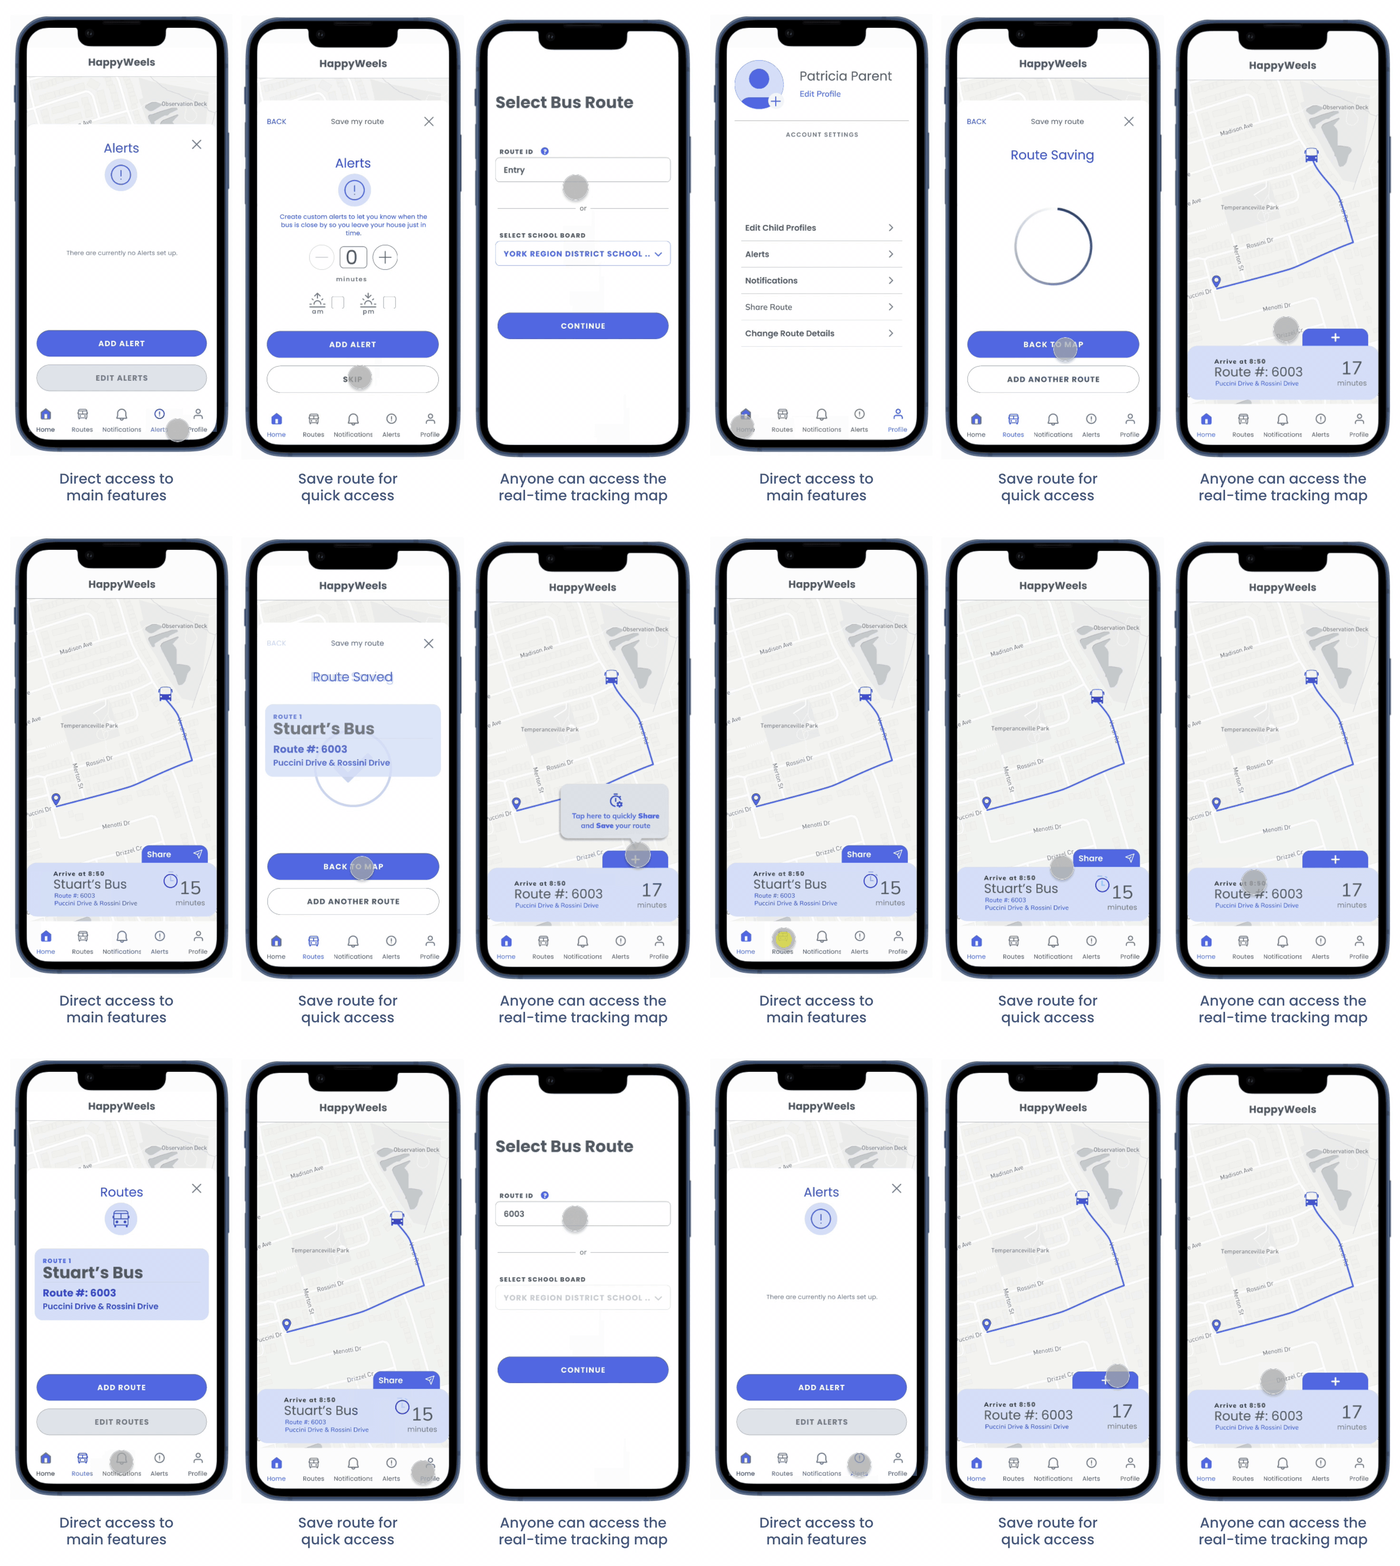
Prototype Phase – Digital Wireframes
We used FigJam to develop our user flow.
Discussed which features would be back-end/intuitive, eg. if users already signed in and saved a route, then how would that affect the path they’d take to access the features as opposed to new users wanting to access the features for the first time? How would that affect their experience?
What about security? We wanted to allow users to access routes quickly and easily without having to sign in, but what if they wanted to use the other features… should they log in to customize them?
Eventually, we stepped back and decided to allow usability testing decide that for us.


Testing Phase
When the time came to test our prototype, we developed a Usability Testing Plan, outlining 4 tasks for users to complete. Each task was geared around answering the following research questions:
- Are users able to quickly find the status of their bus route with either the route number or school board?
- Are users interested in saving the route details, and if so, how easy is it for them to do so?
- Do users find it easy to set up a custom alert?
- Which notifications are users most interested in customizing?
92% of users were able to complete all 4 tasks successfully the first time. However, the testing revealed some interesting insights about the flow of our app.
We documented the feedback on the testing plan, as well as plotted it on a Figjam board to help us define and prioritize which features to iterate.
KPI’s
To measure our success, we tracked the time it took for users to access information about school bus delays using the methods known to them on any given day. This could include using the current school bus website and/or calling the school. We compared that with the time it took our users to do the same thing on our app.
We used a Google survey to retrieve this quantitative data. 16 participants including parents and students participated.
Measuring our Success
Time currently taken for users to track bus delays
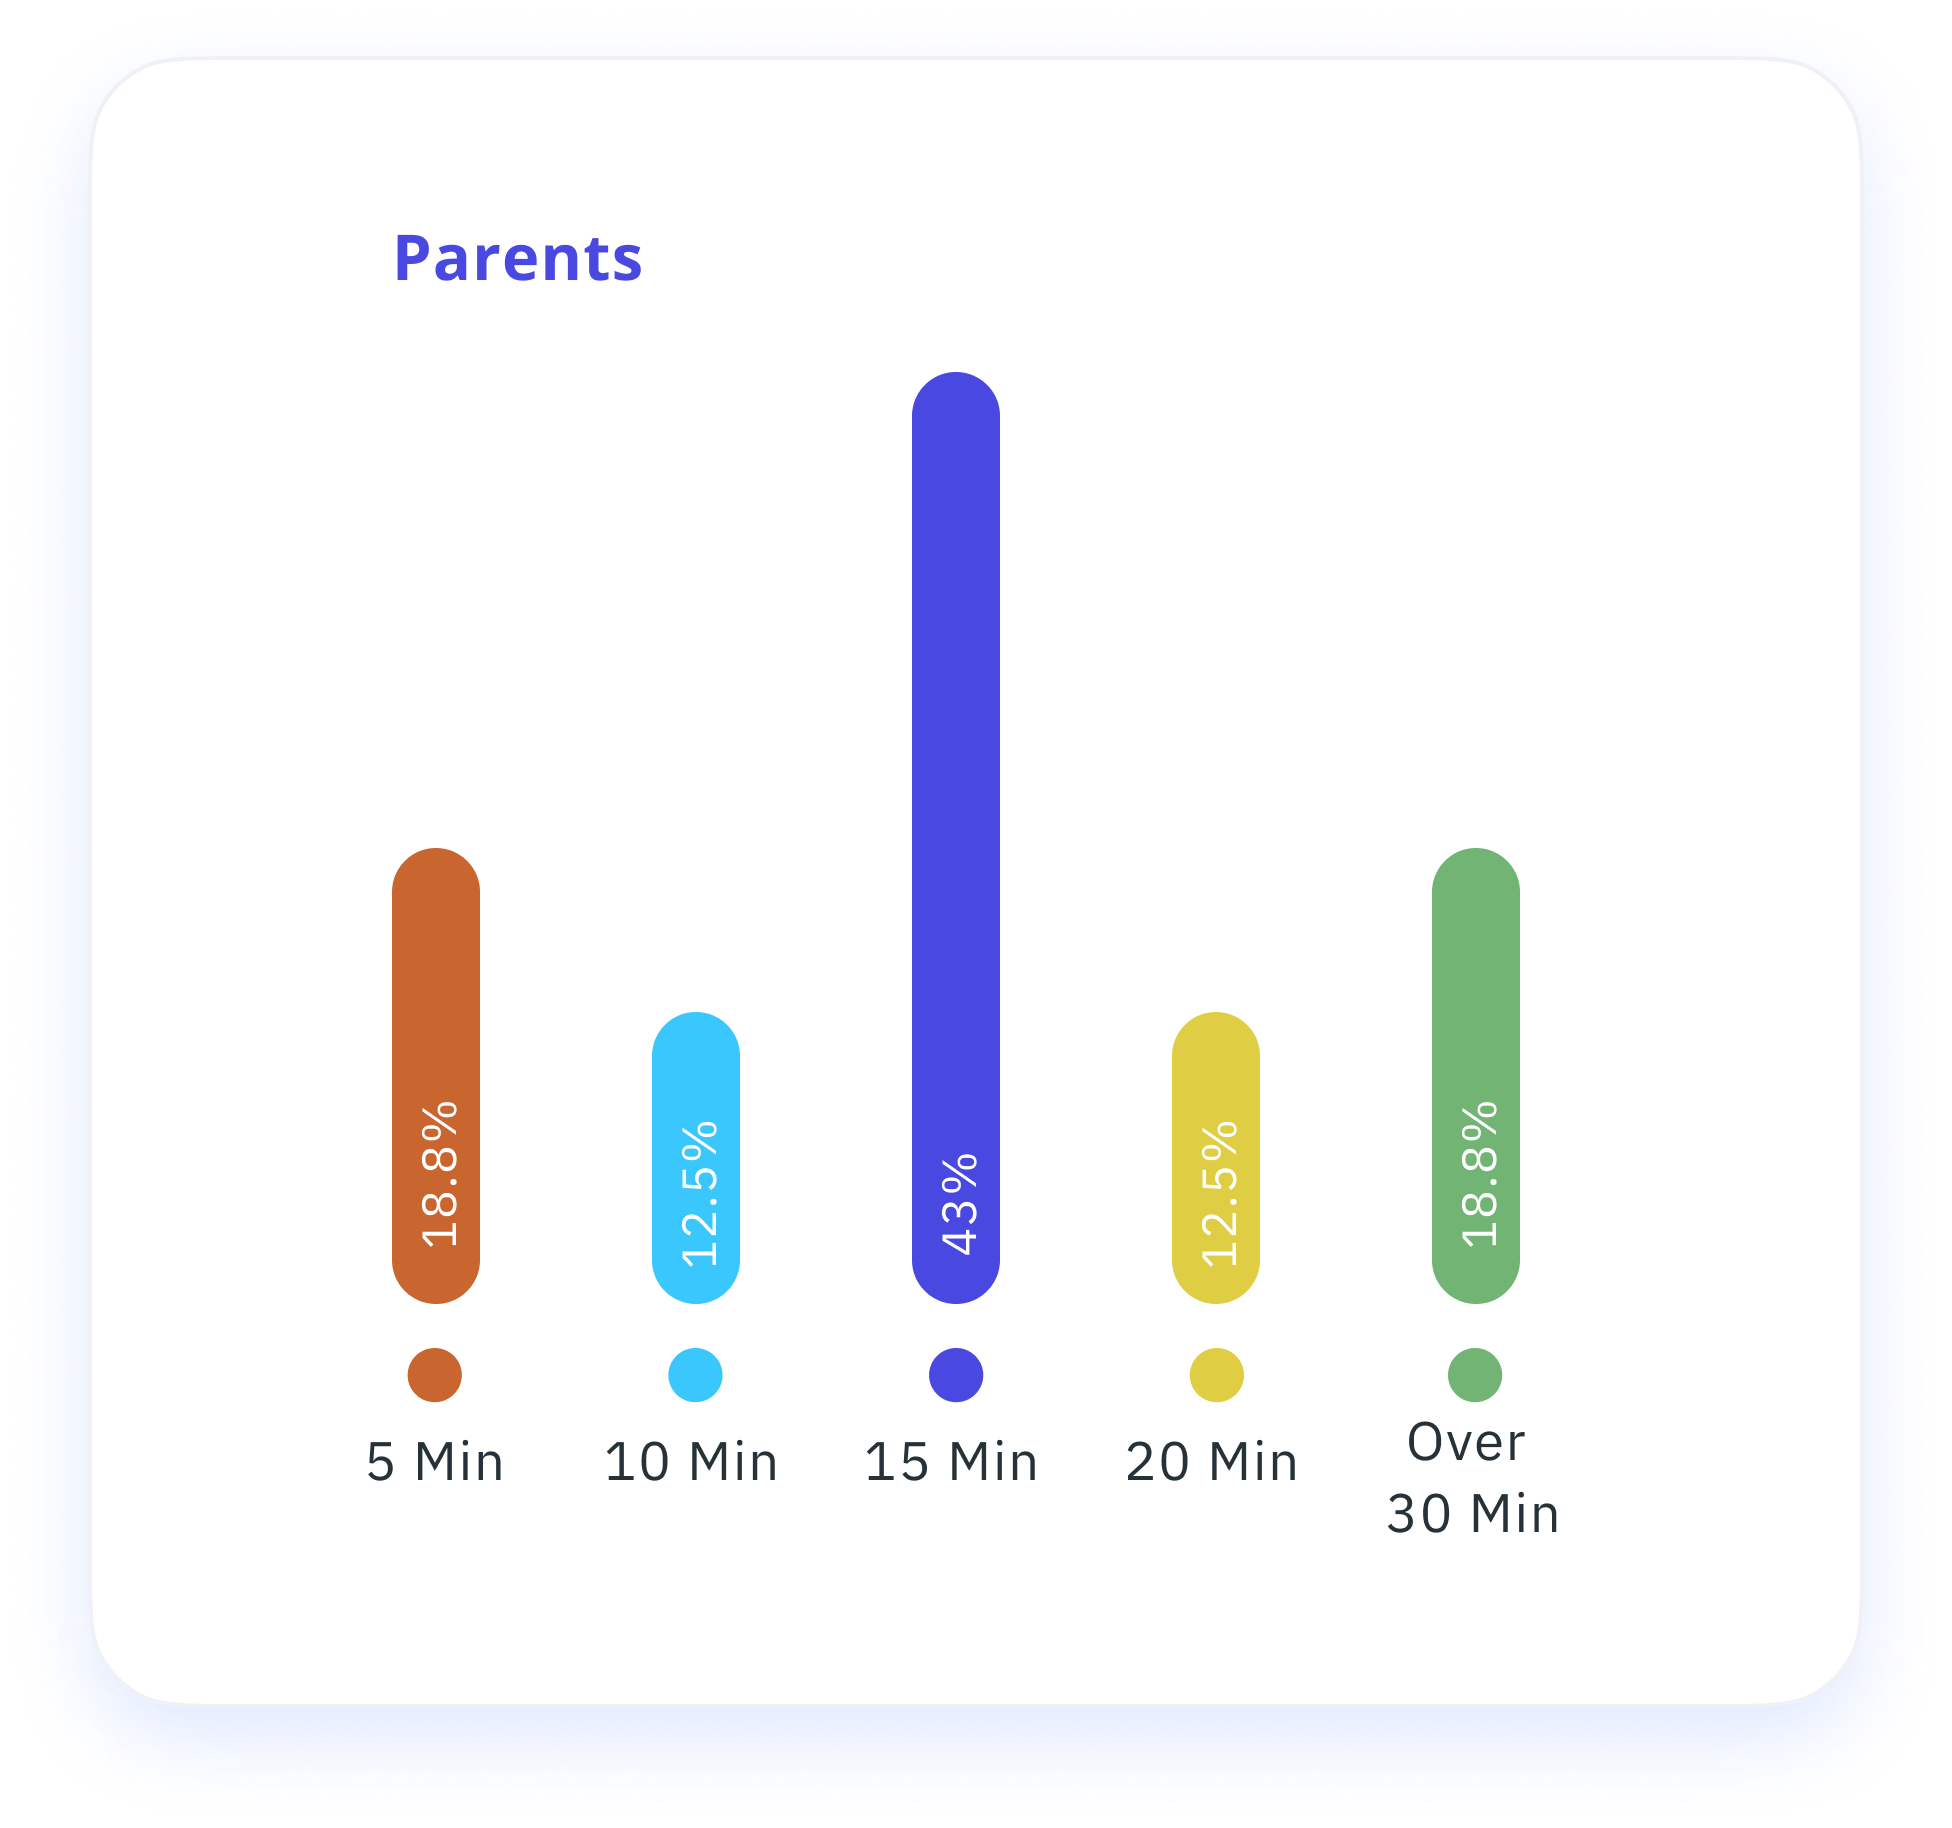
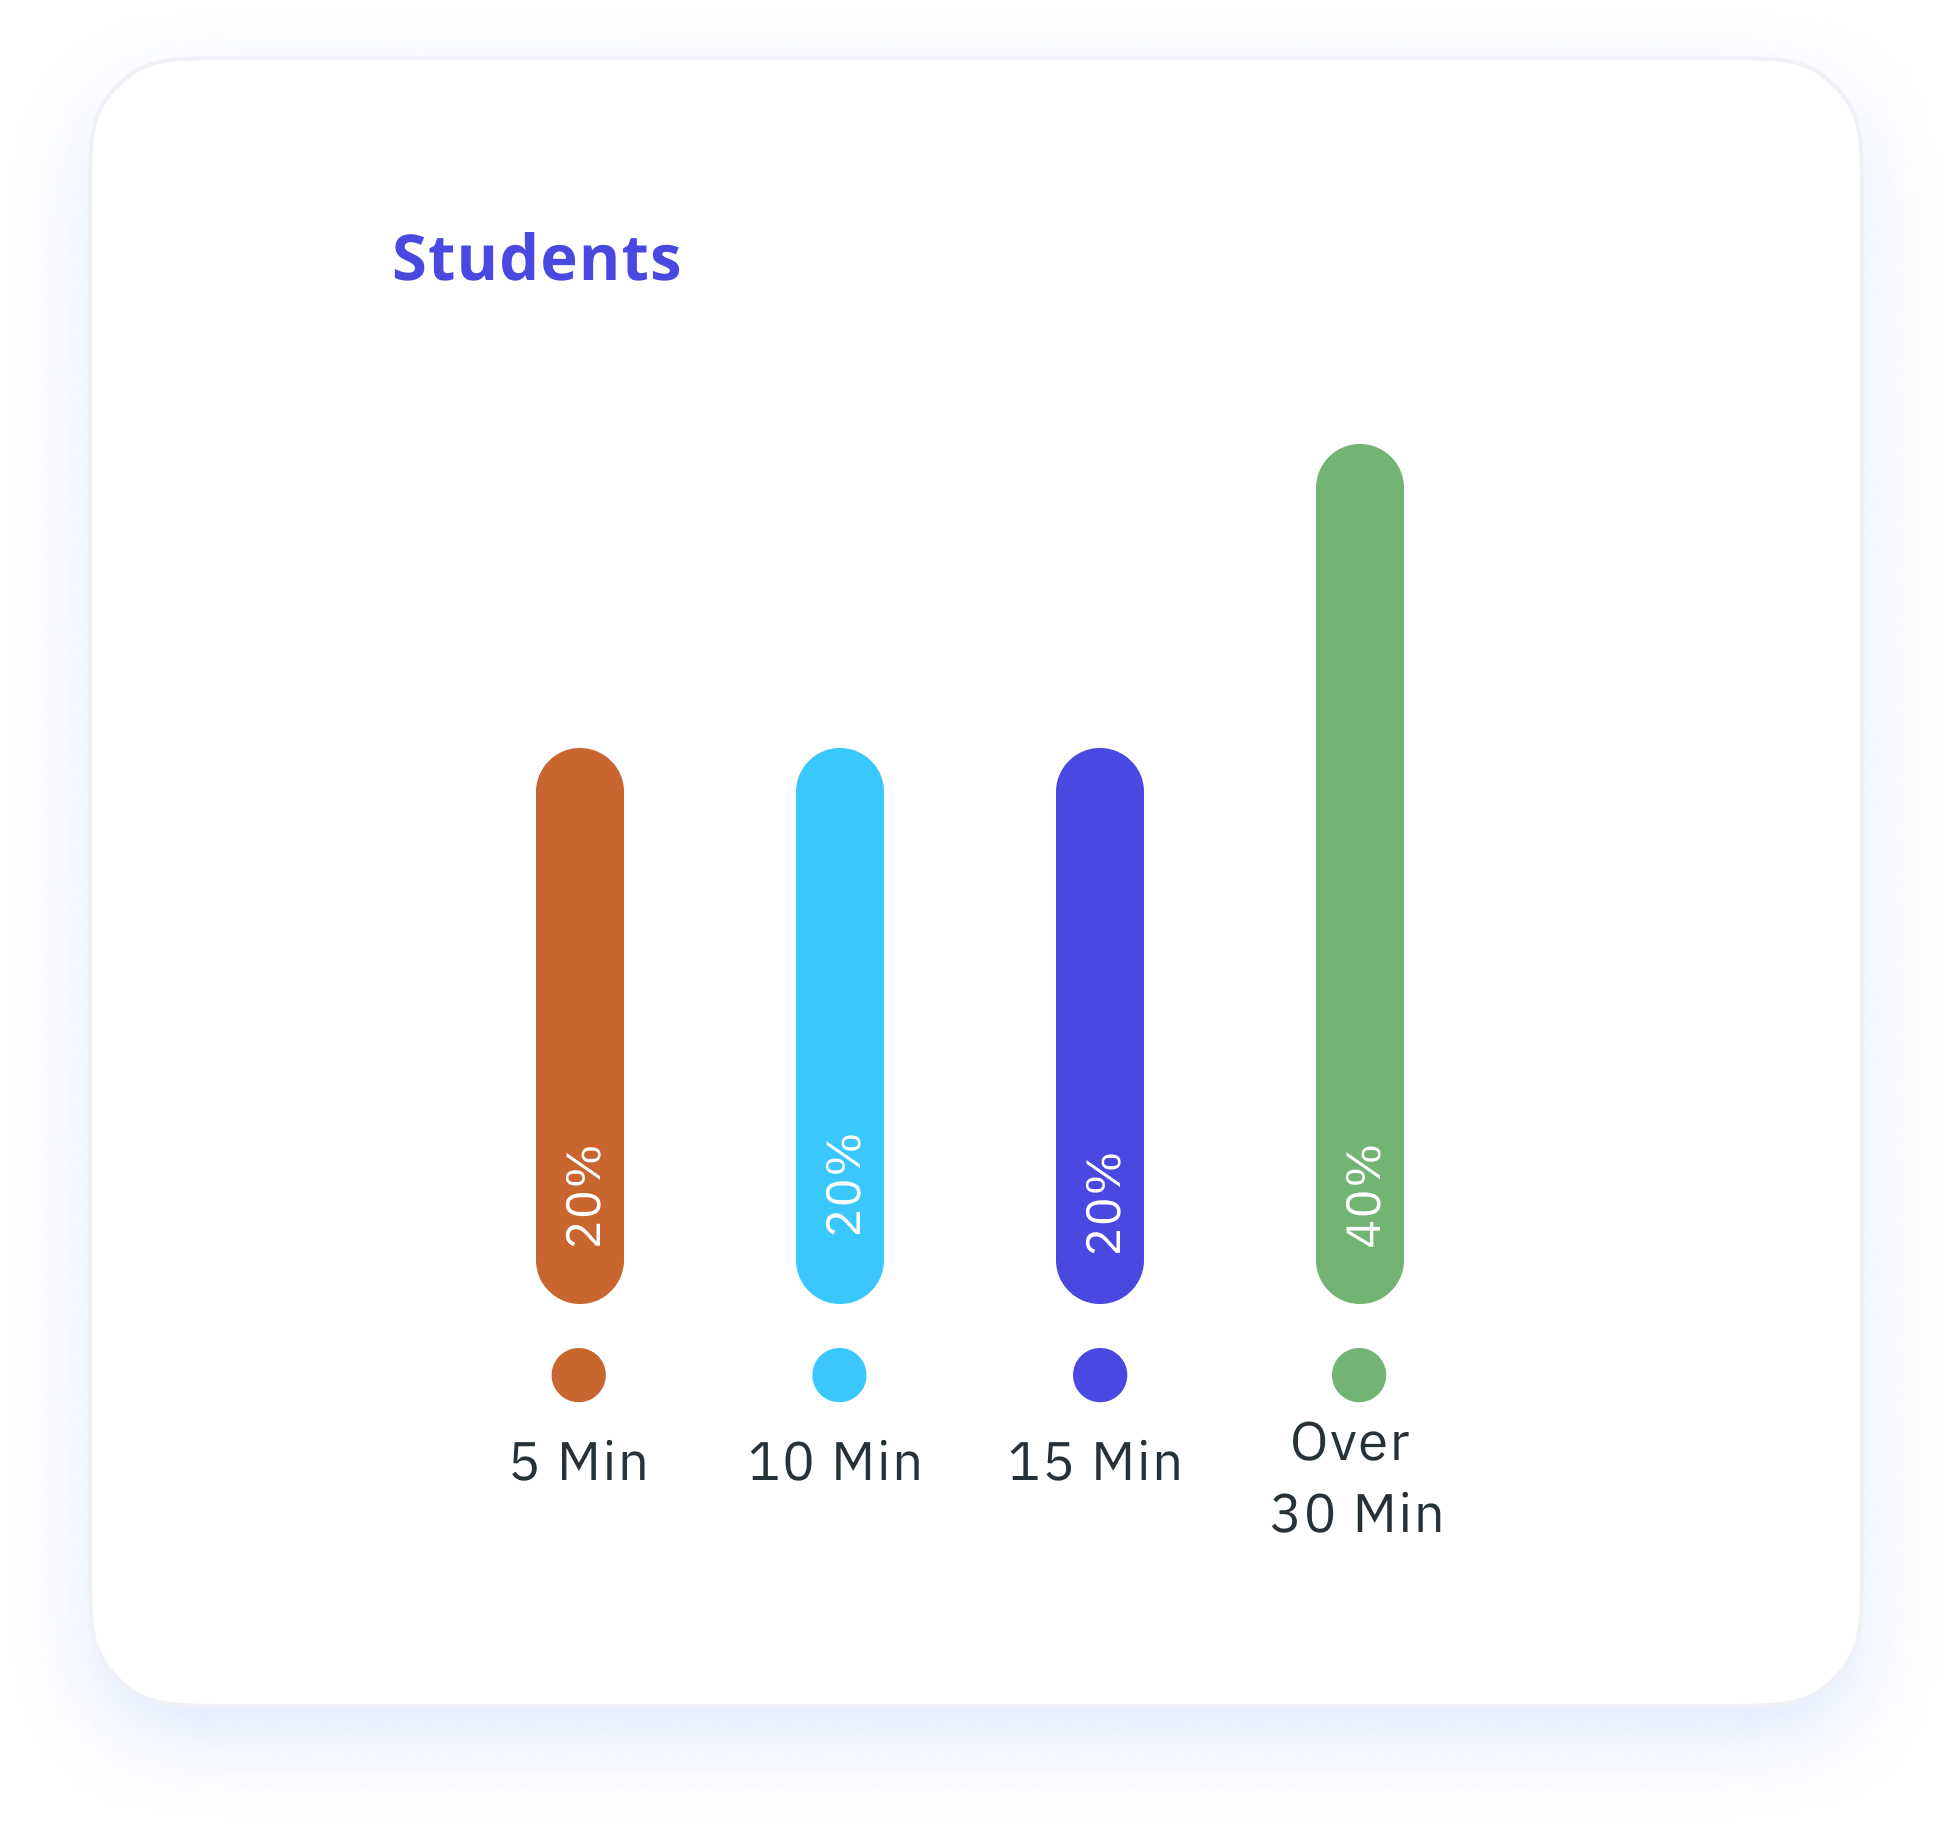
Time is currently taken for users to track bus delays using HappyWeels
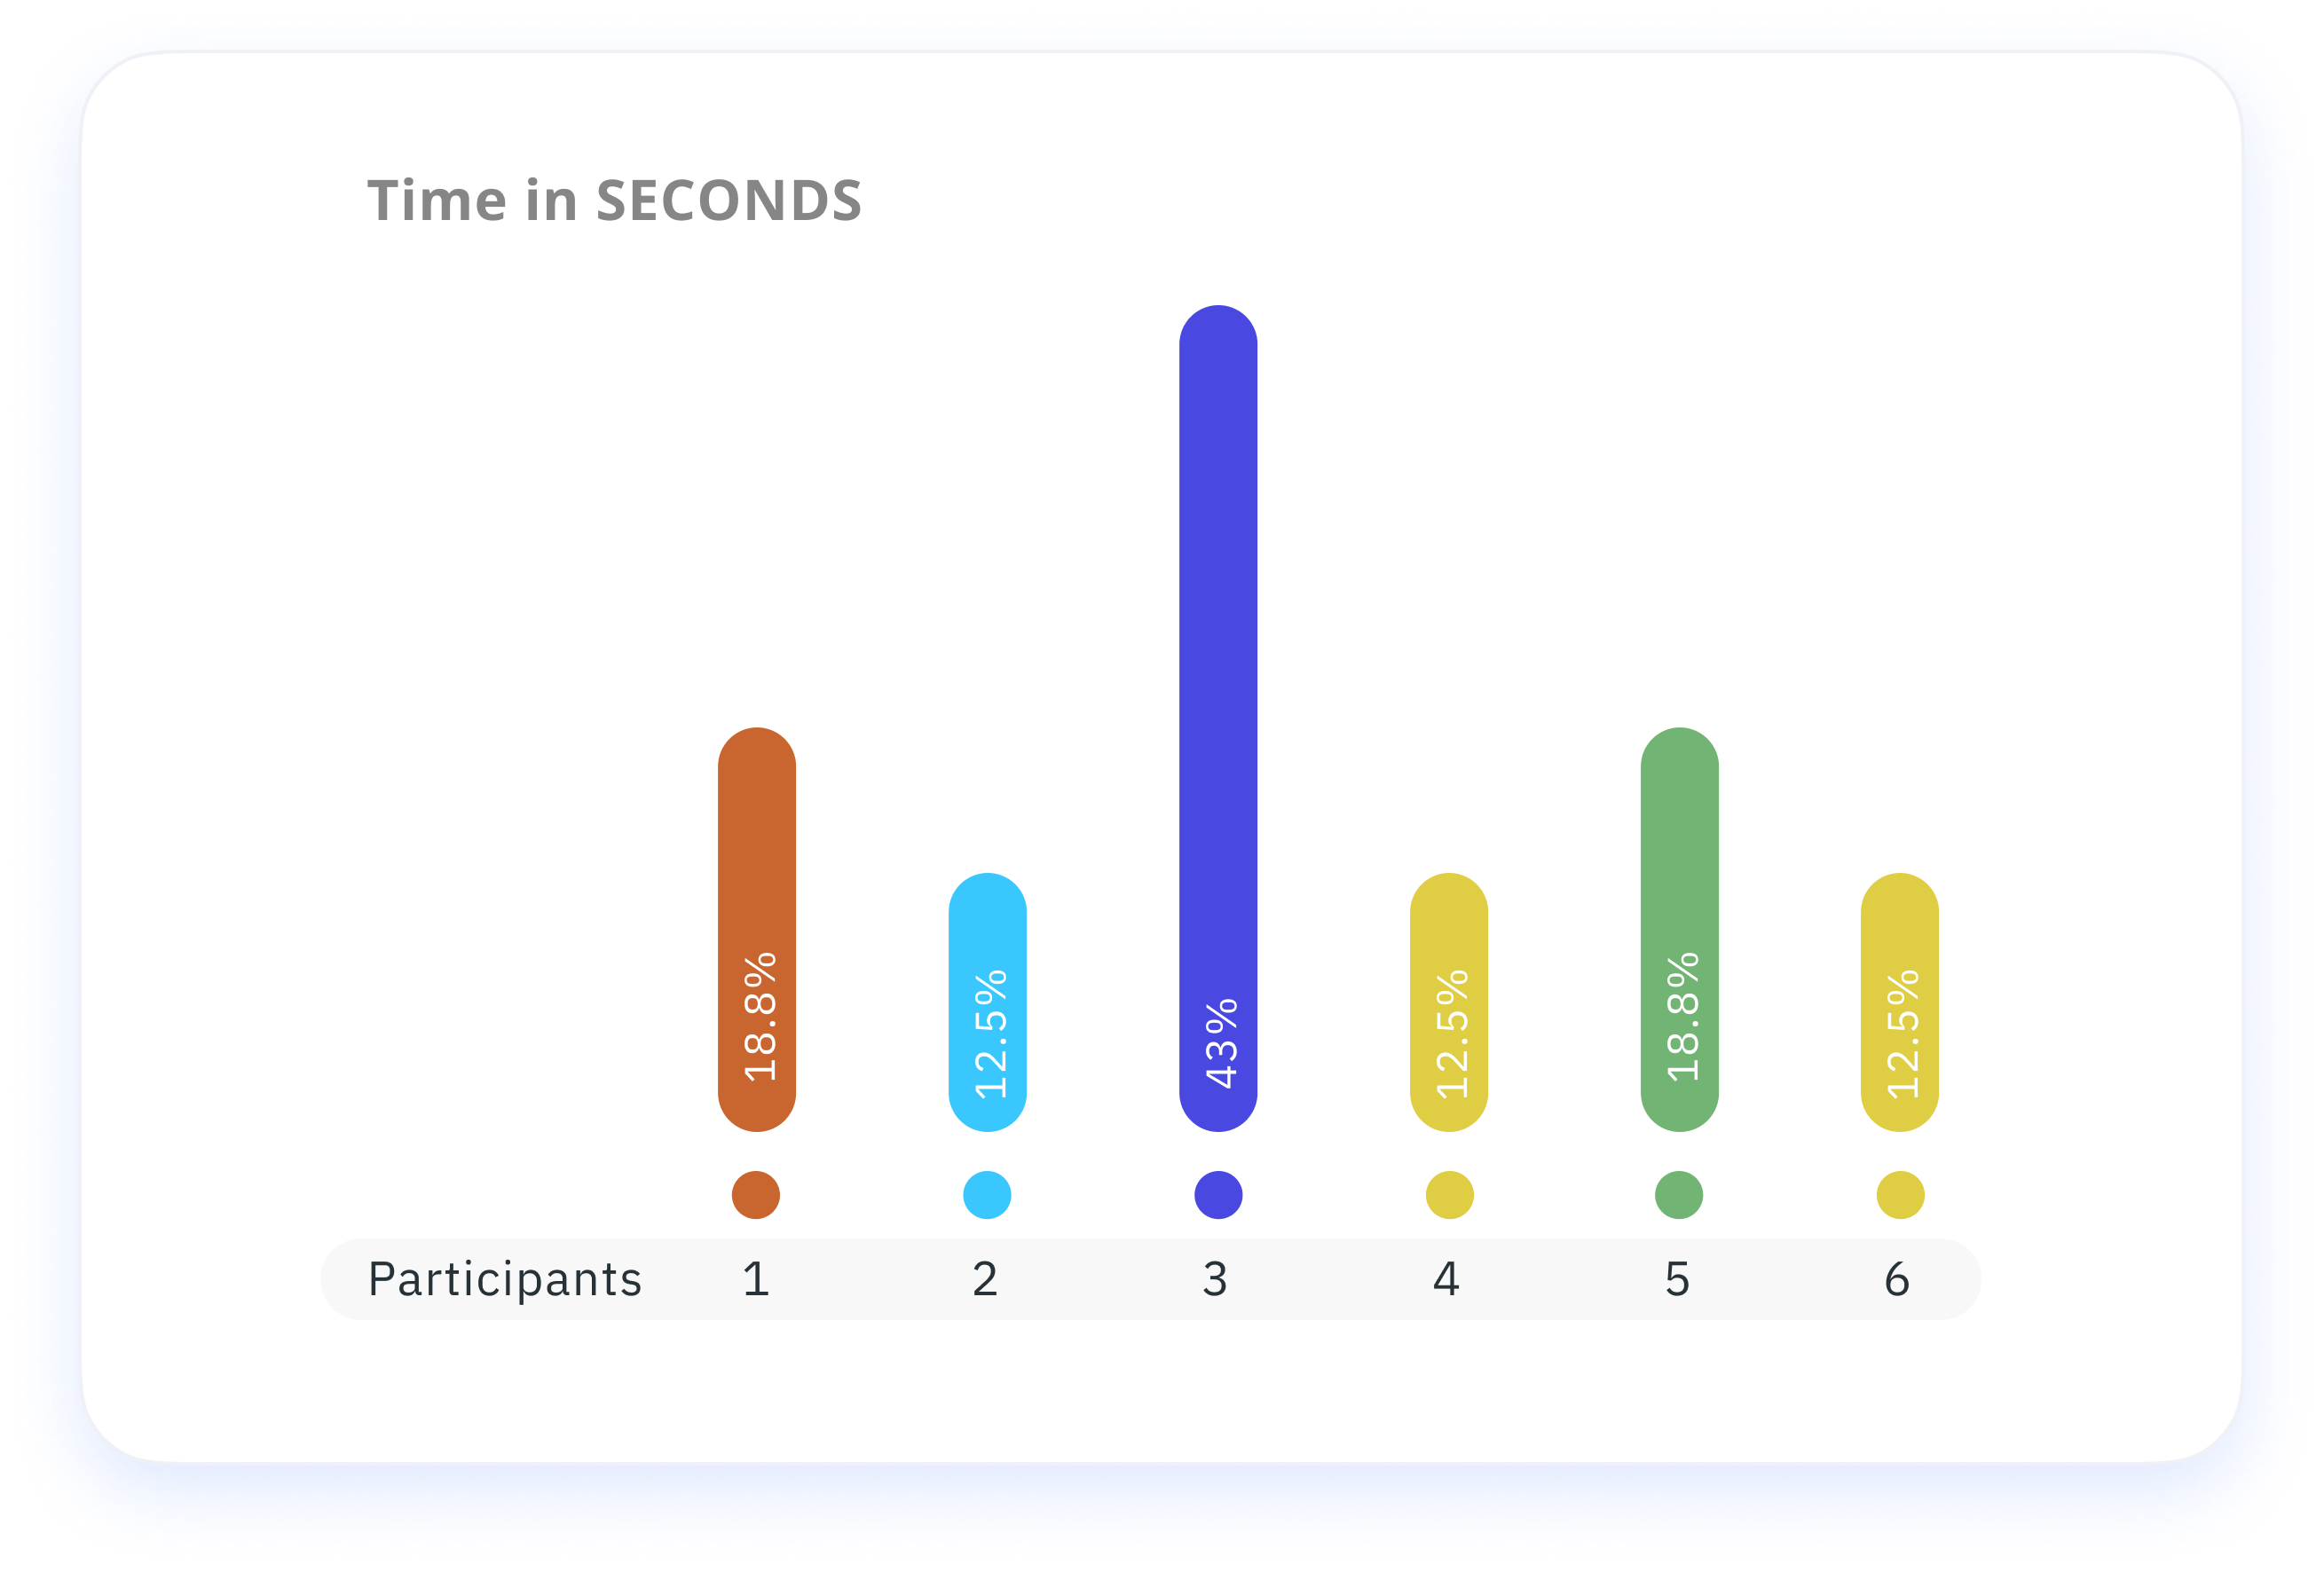
Our app would also have a greater impact outside of the parent/child bus-tracking model:
- If parents were able to access real-time information on bus delays, there would be no need to call schools and schools would have no need to contact the bus company, thus alleviating the strain on school and bus company staff in the mornings – which can be stressful enough as it is.
- For disabled children needing to wear harnesses or uncomfortable devices while waiting for the bus, it would reduce stress and anxiety on them, their teachers, as well as parents/caregivers.
- Reducing road rage from parents having to take their children to school and being late for work
- Giving school boards greater credibility when it came to offering support for parents and their children.
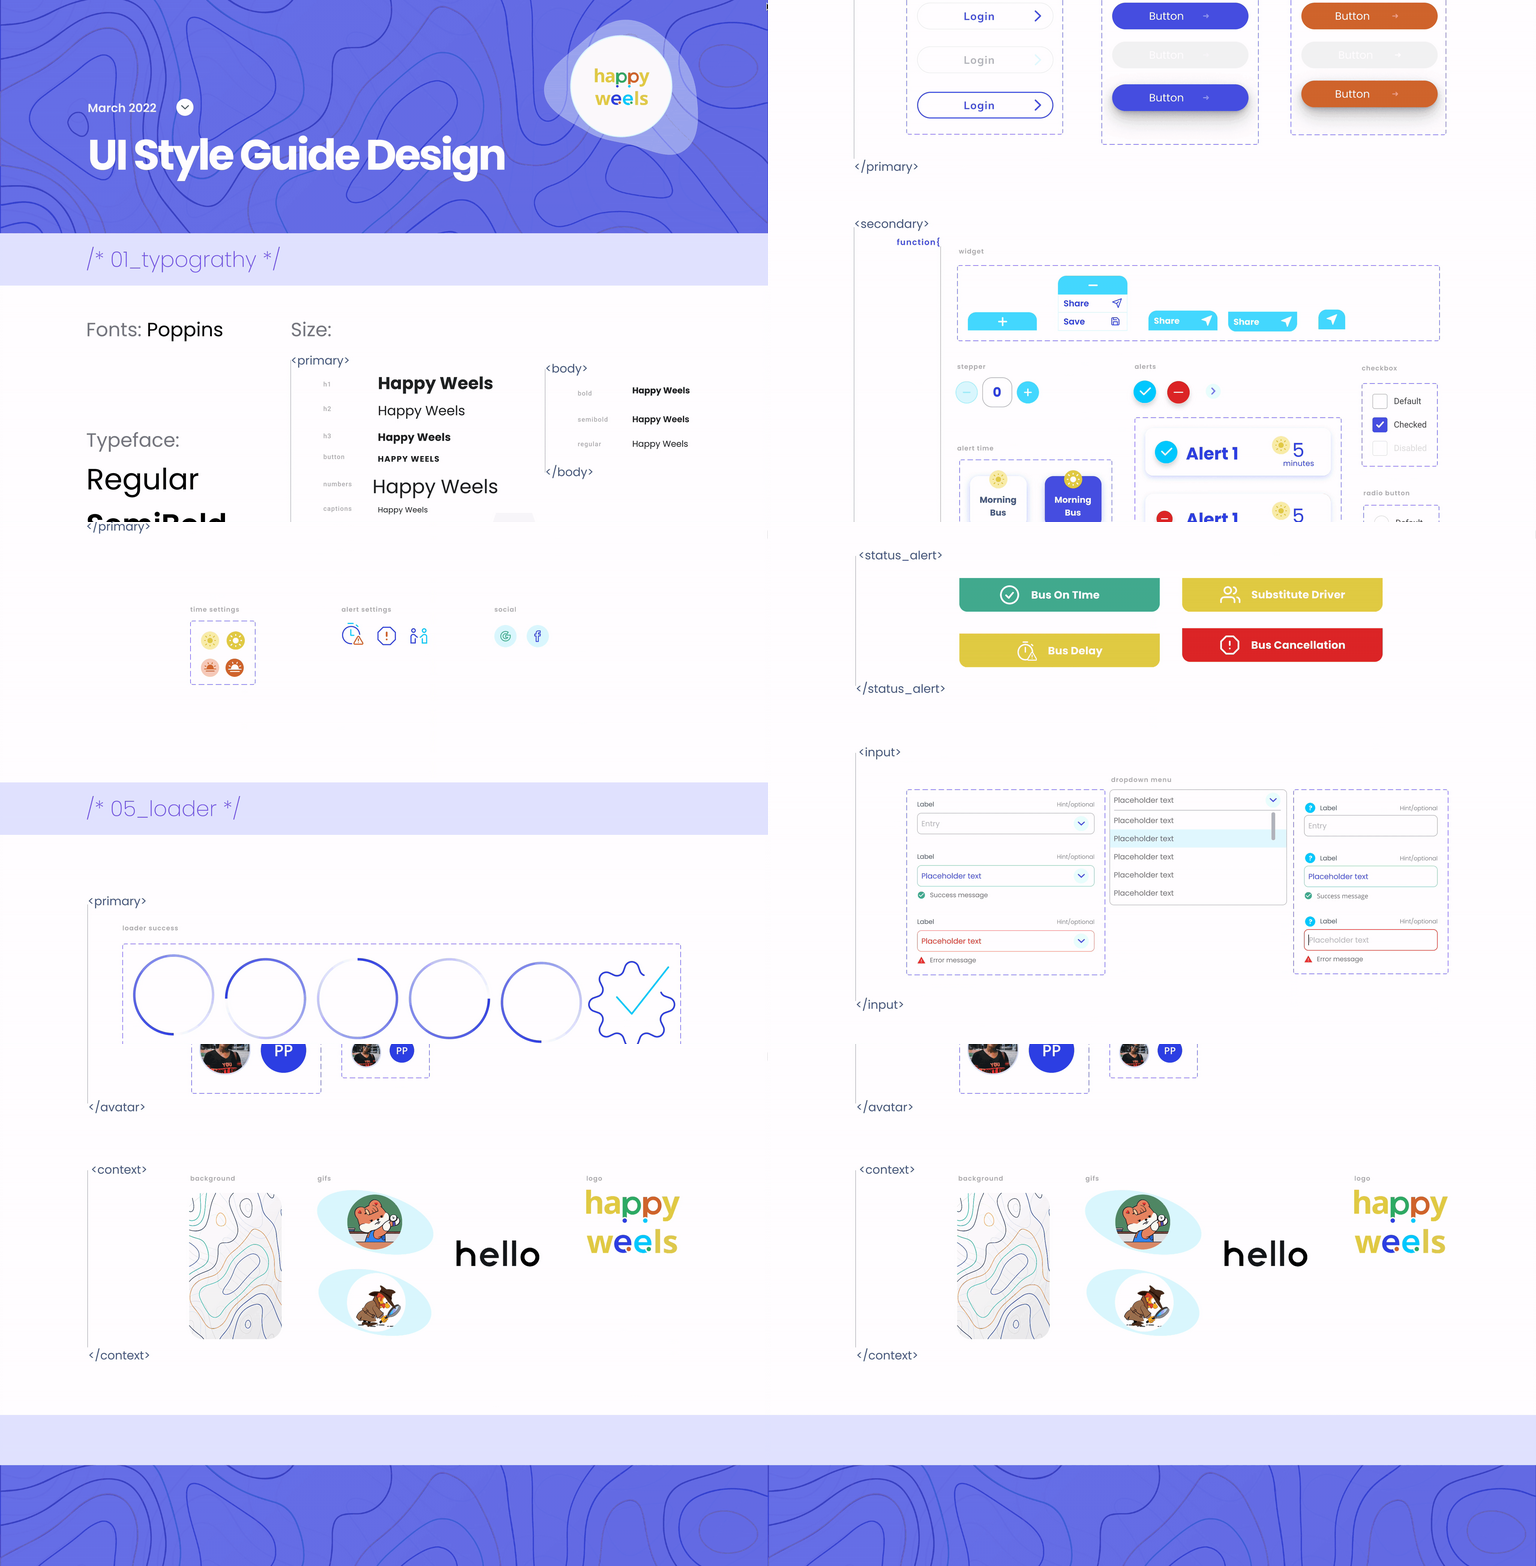
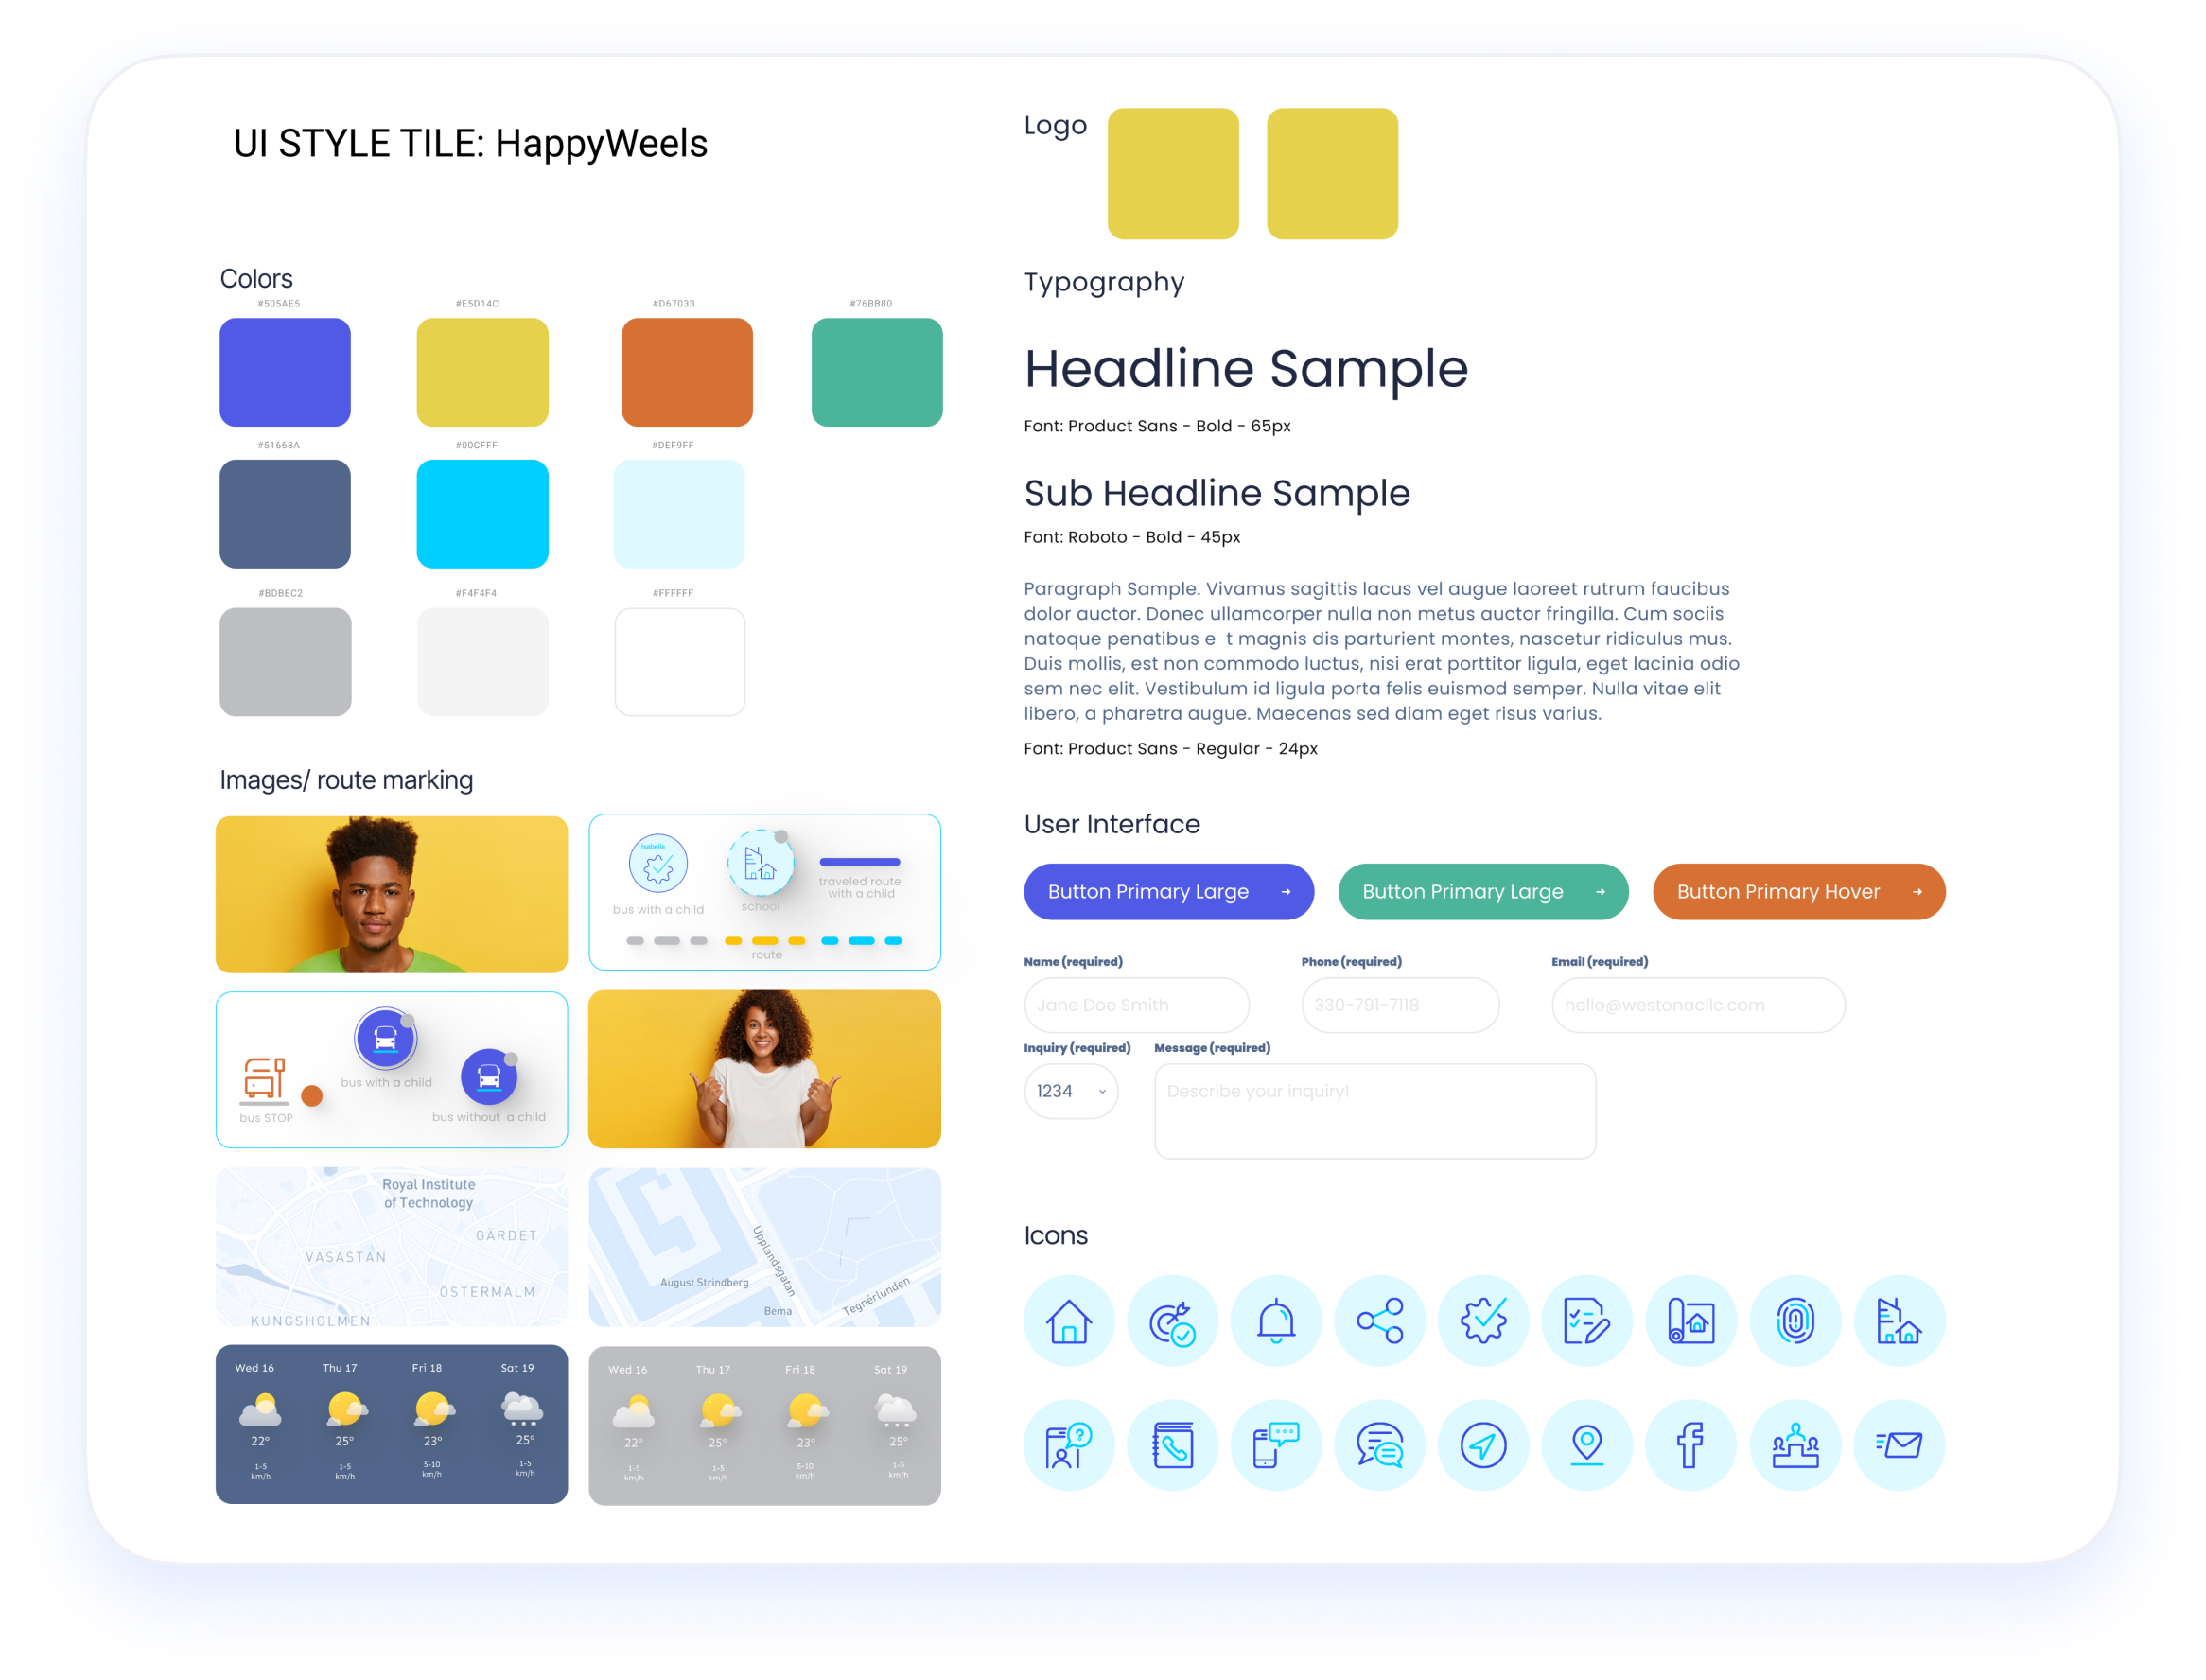
Style Tile and Design System

Prototype Phase
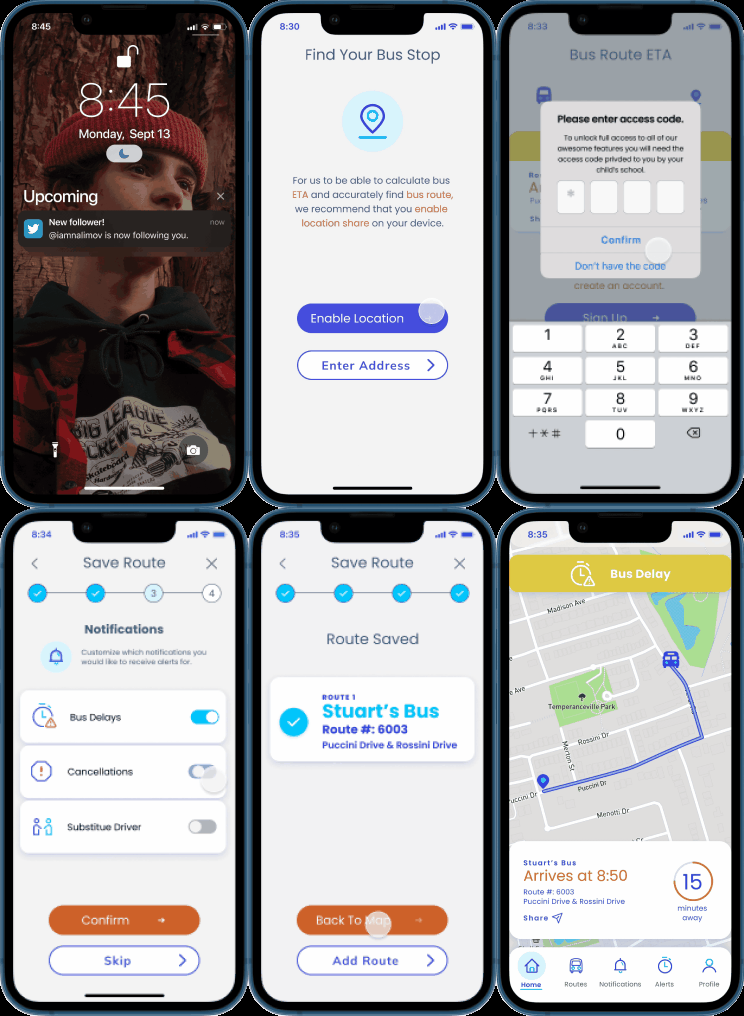
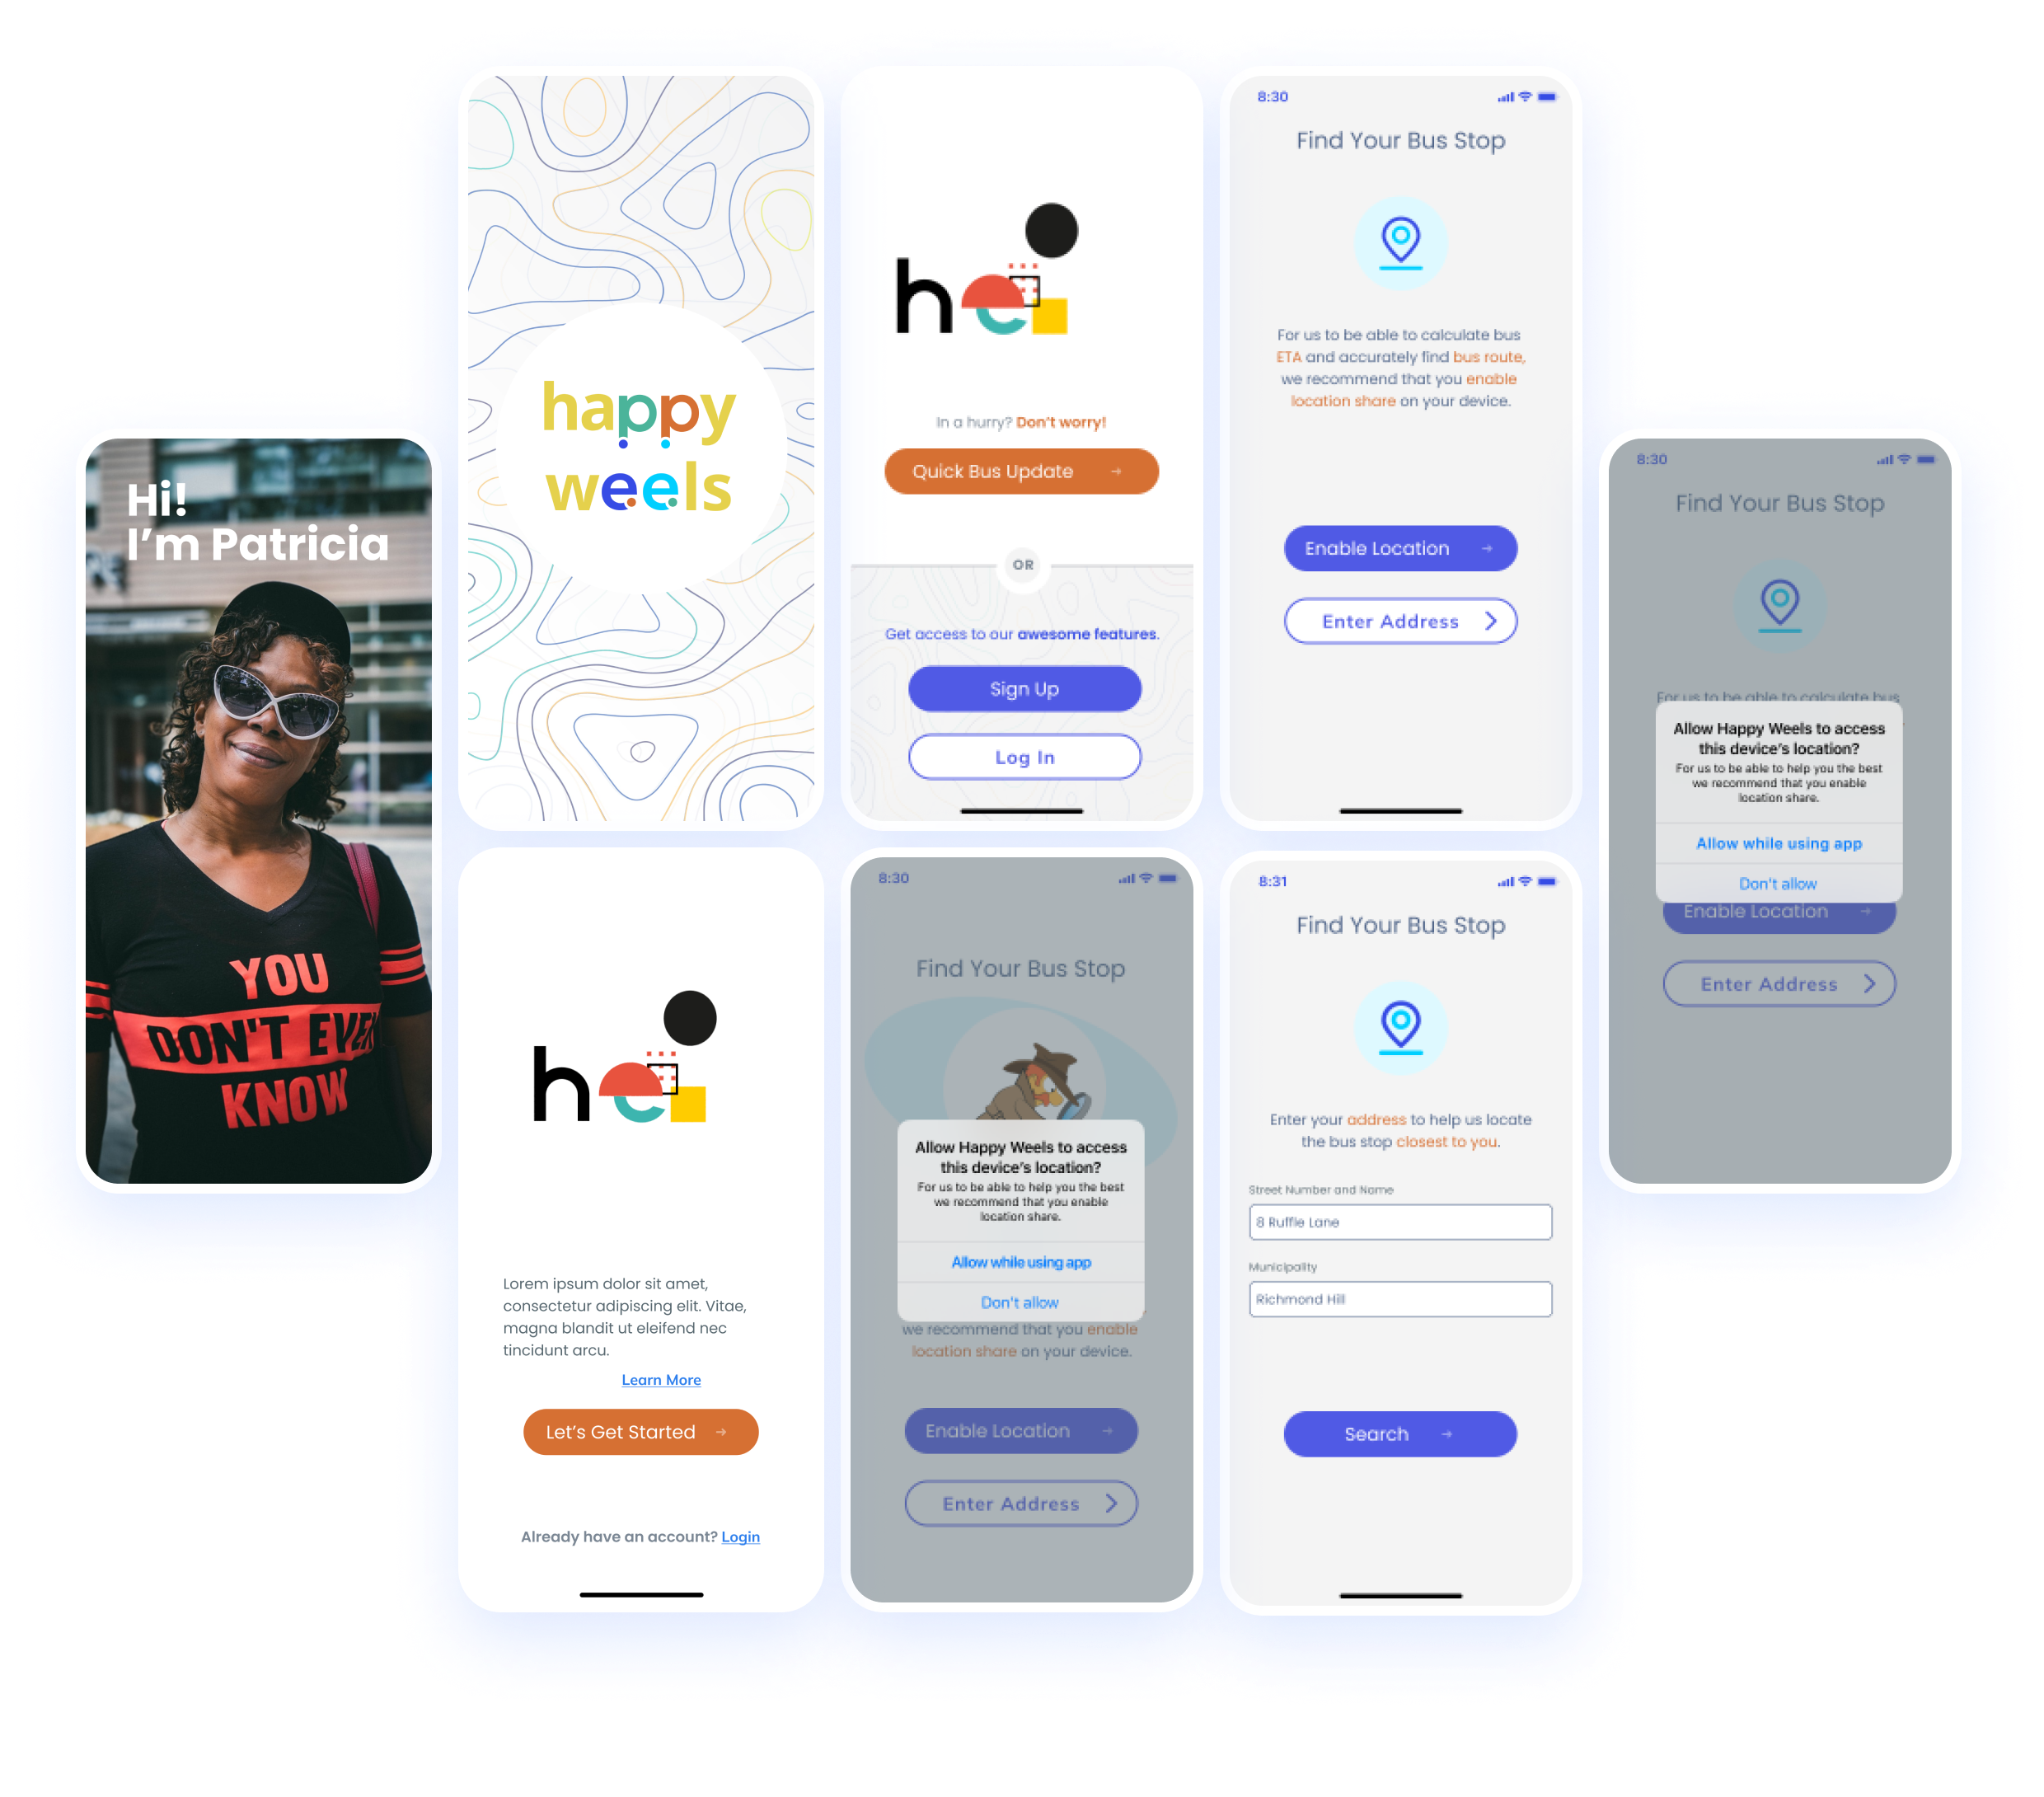
High Fidelity Prototype

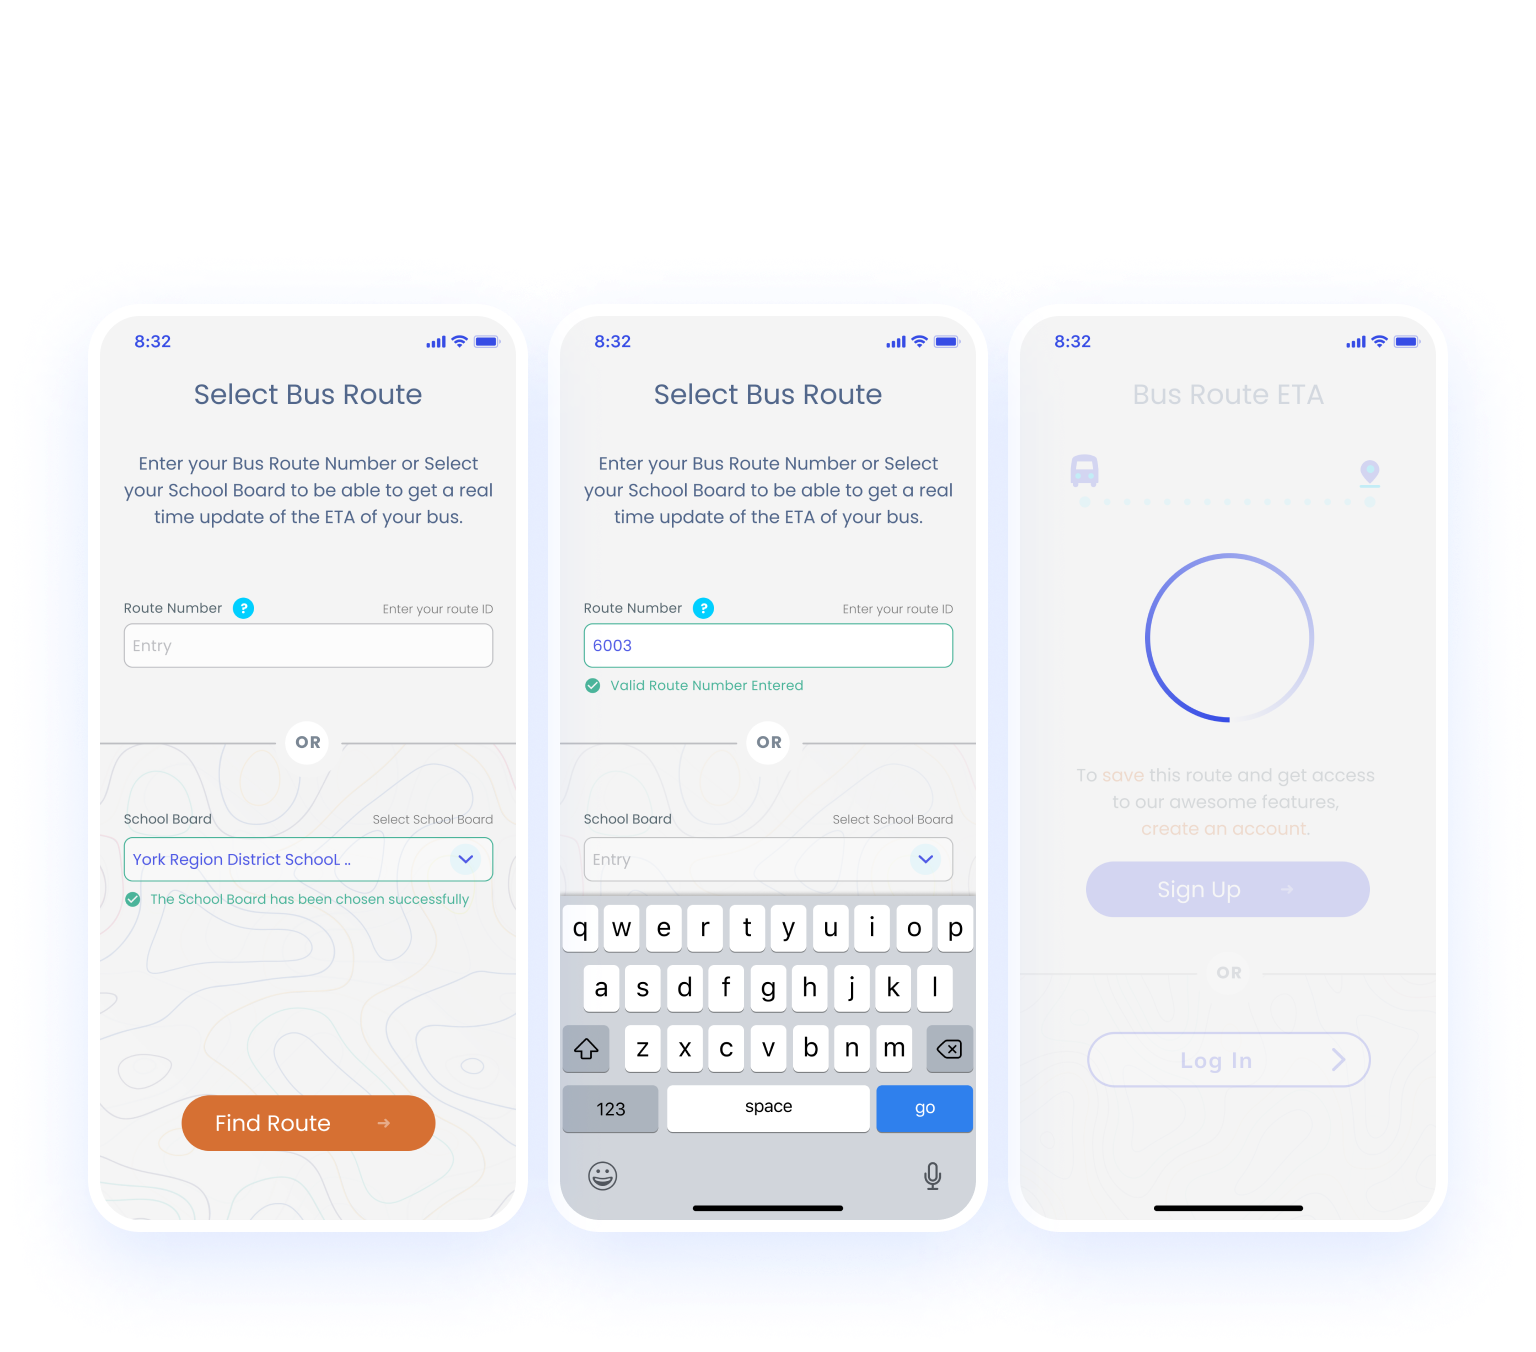
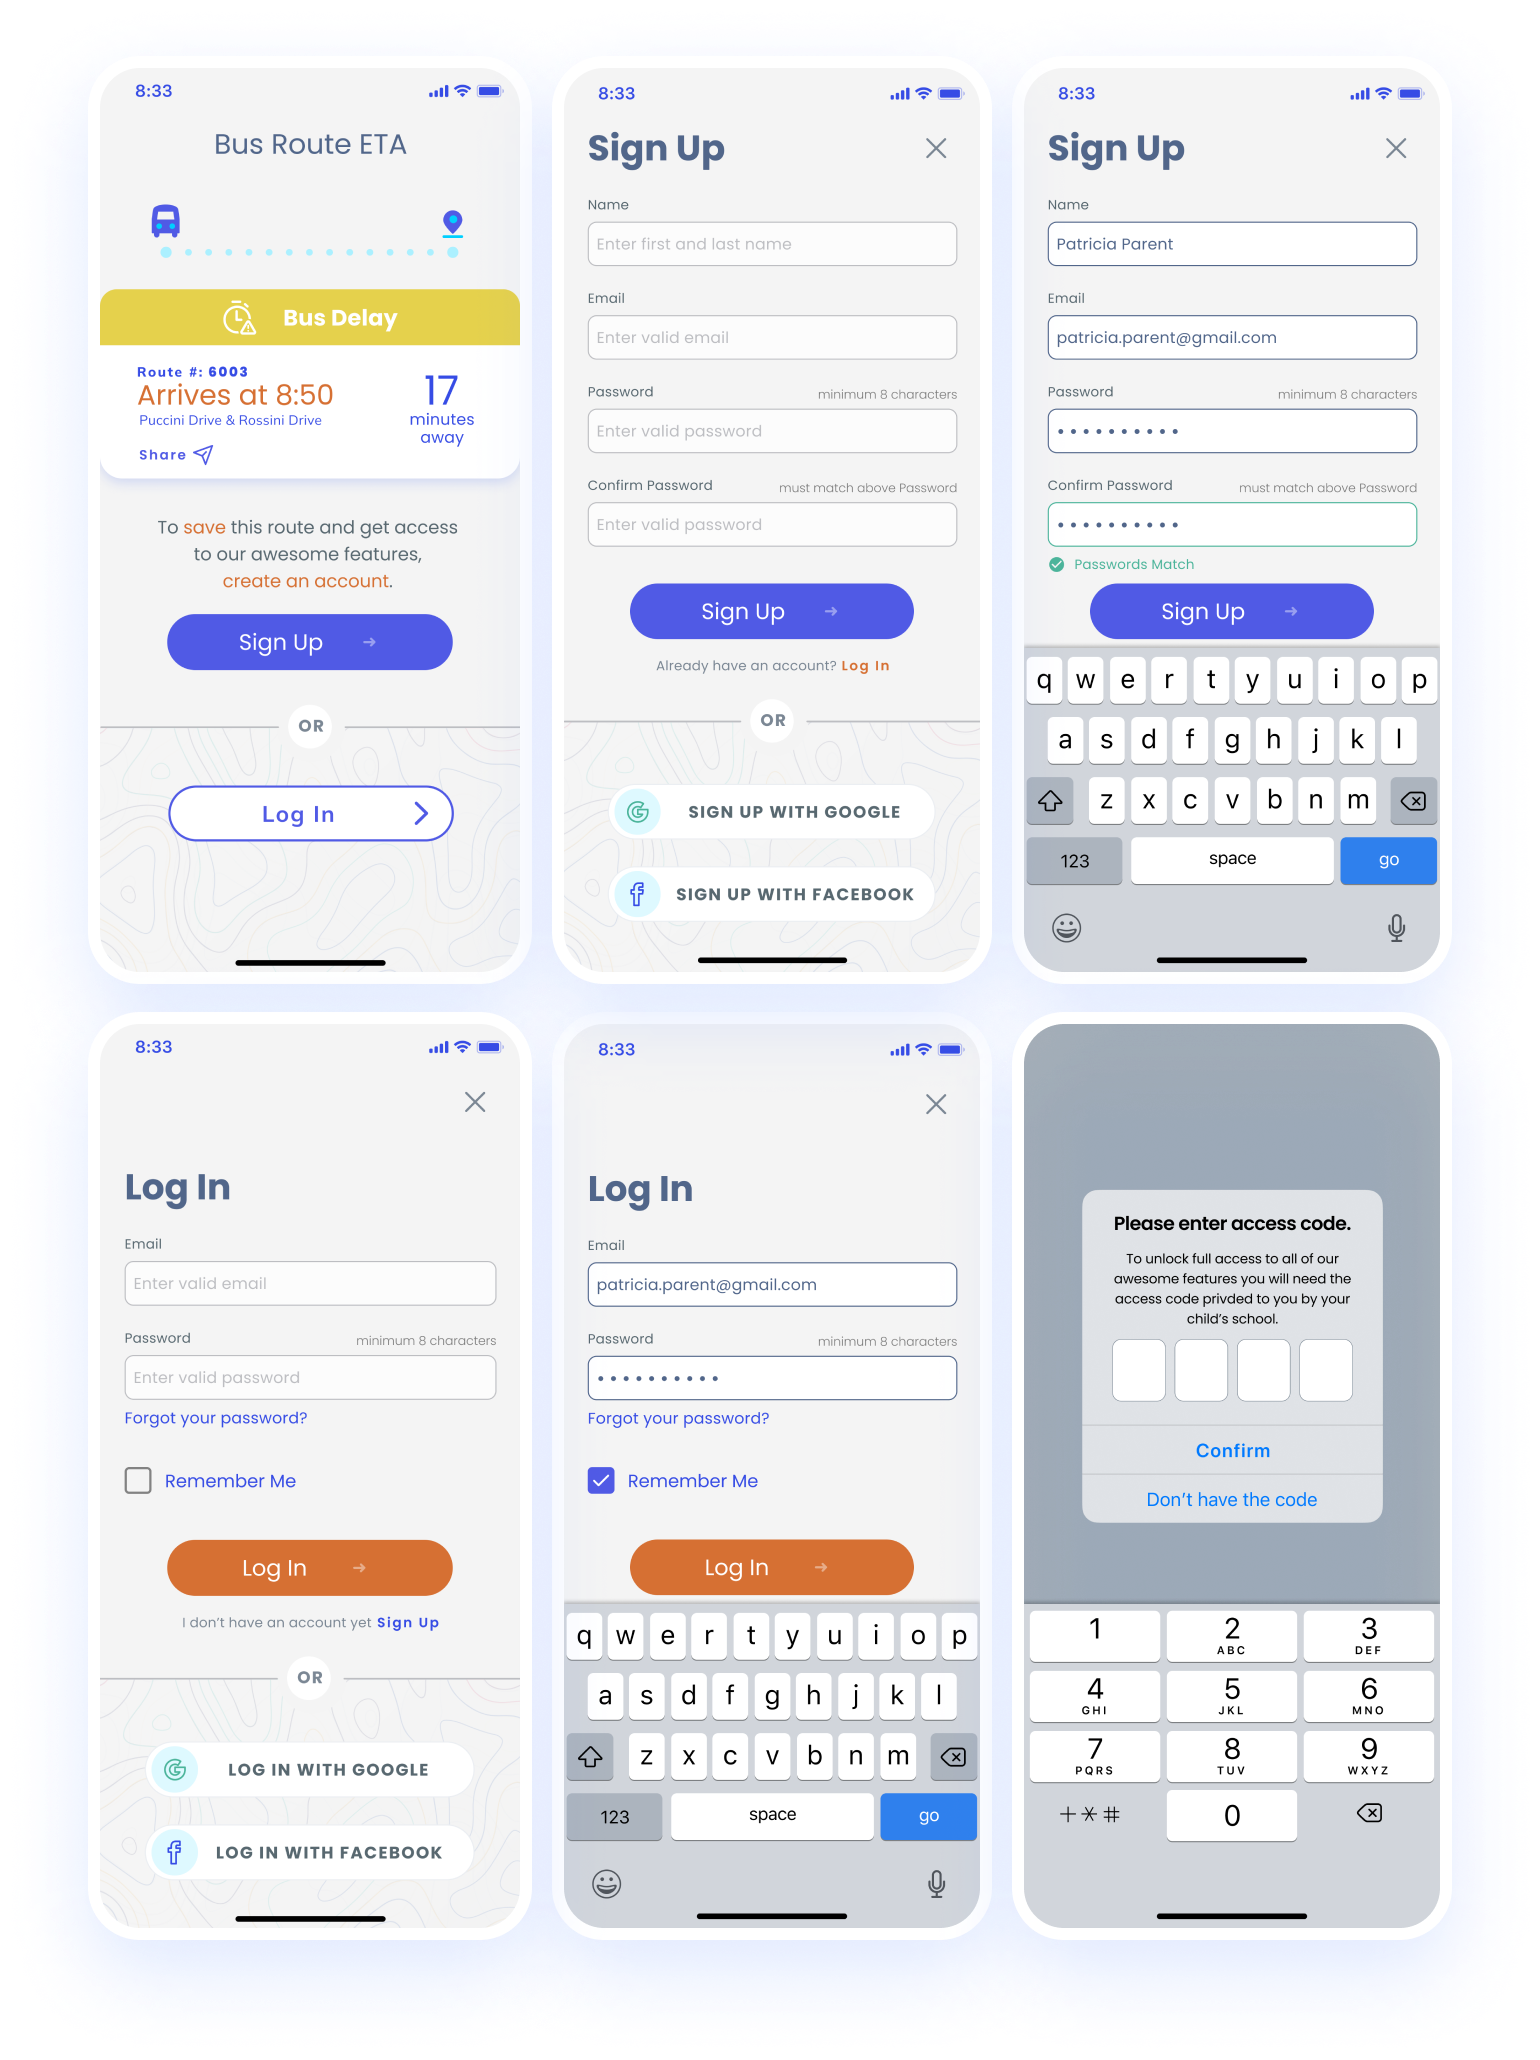
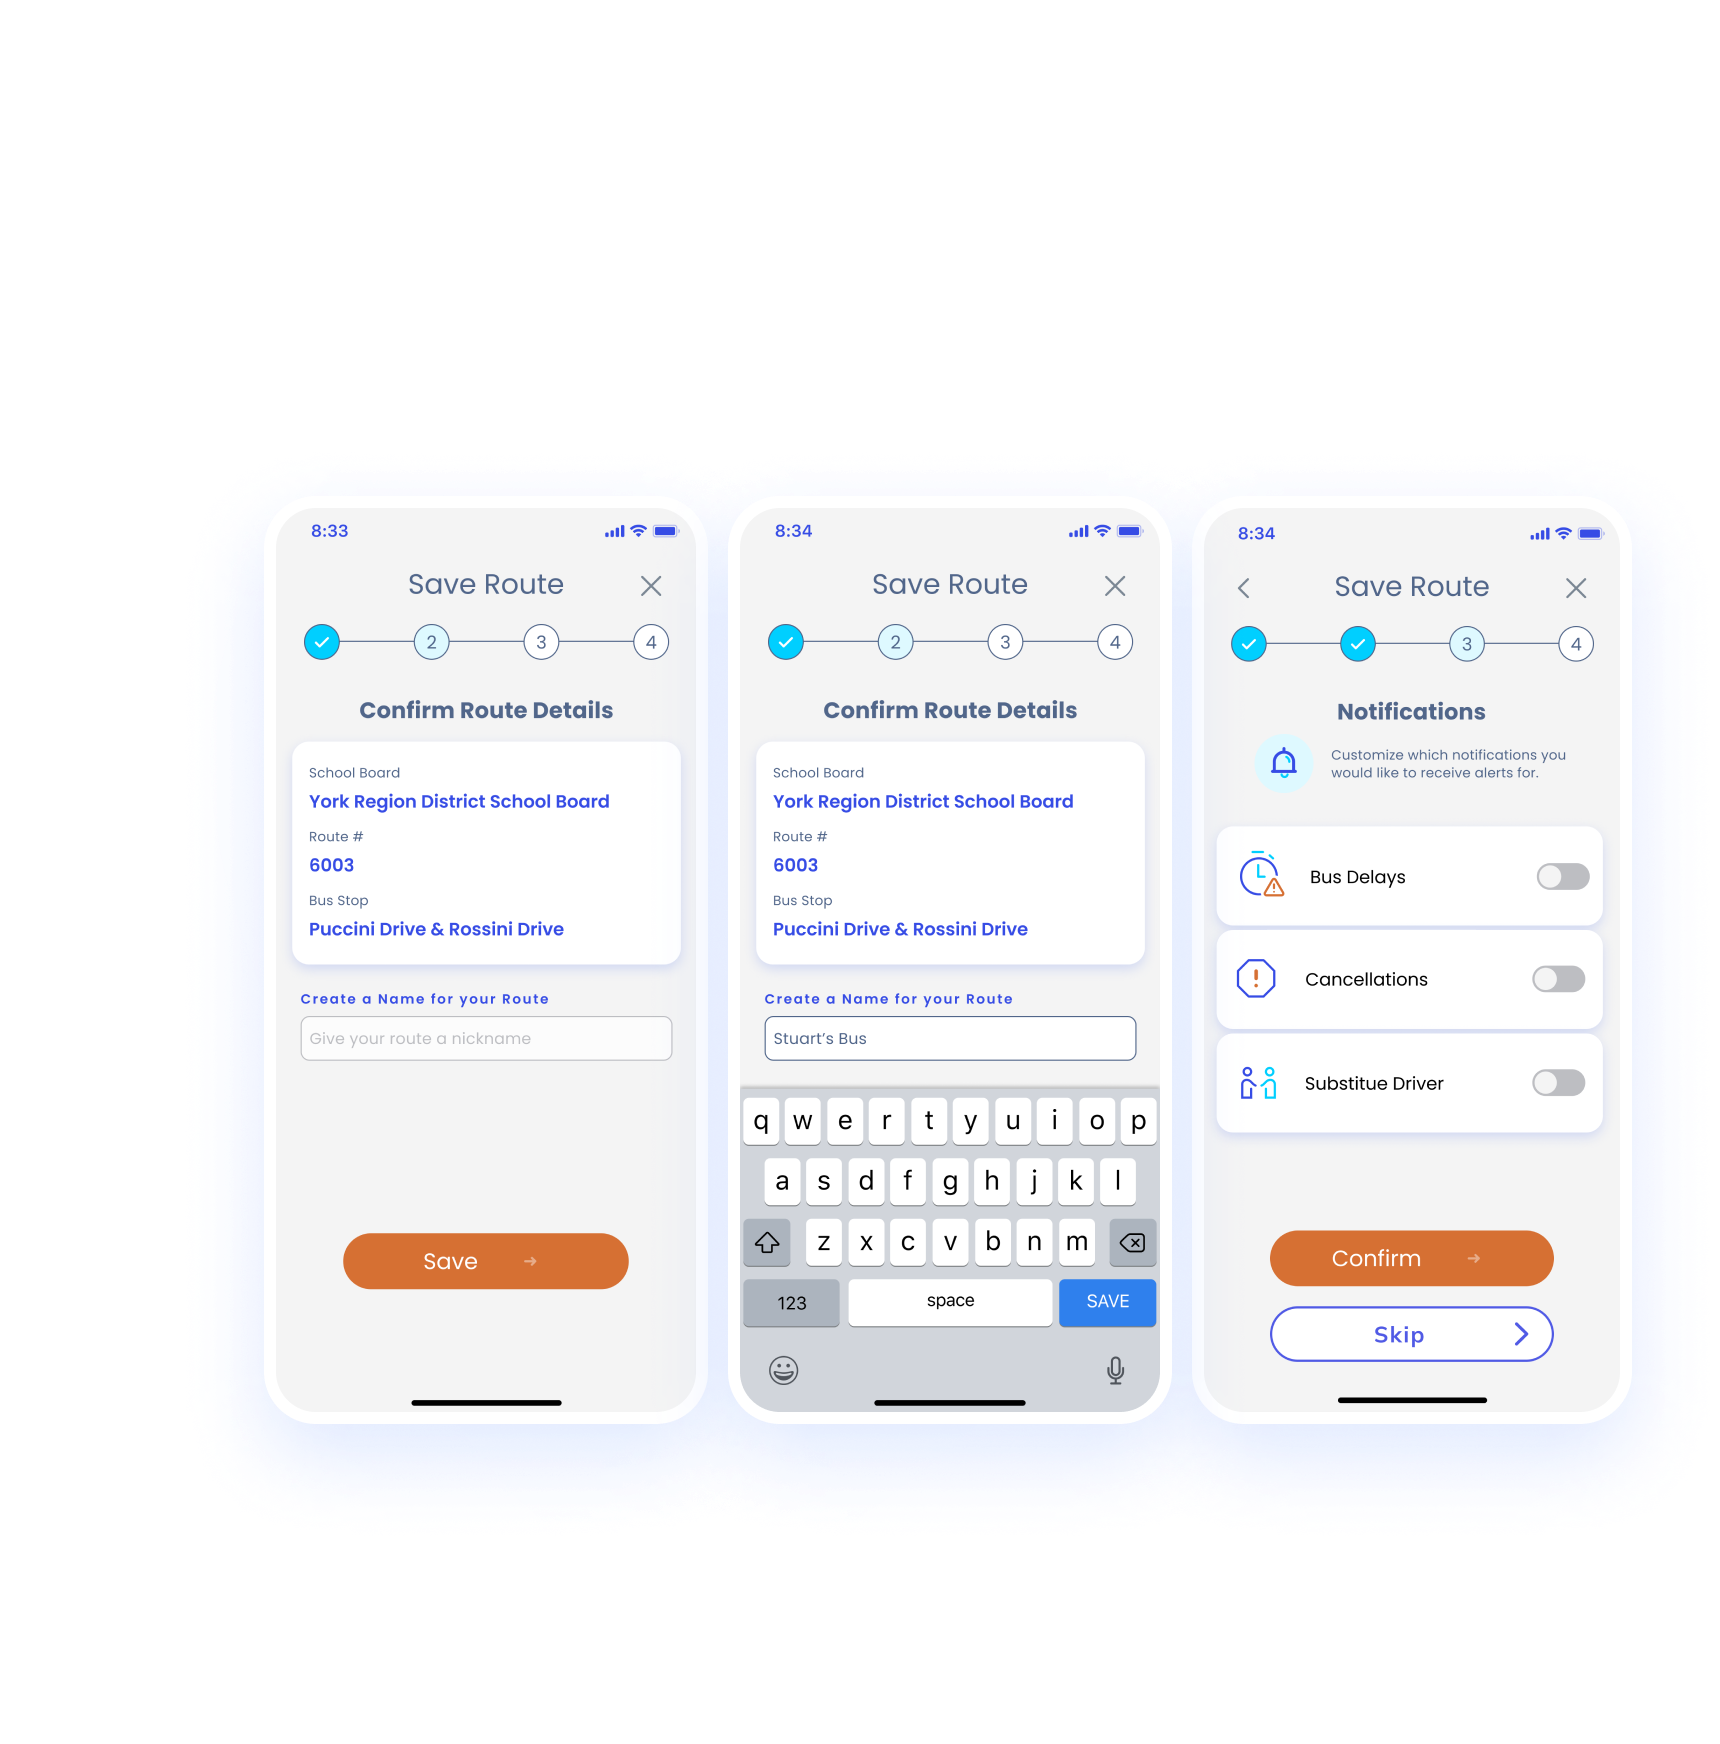
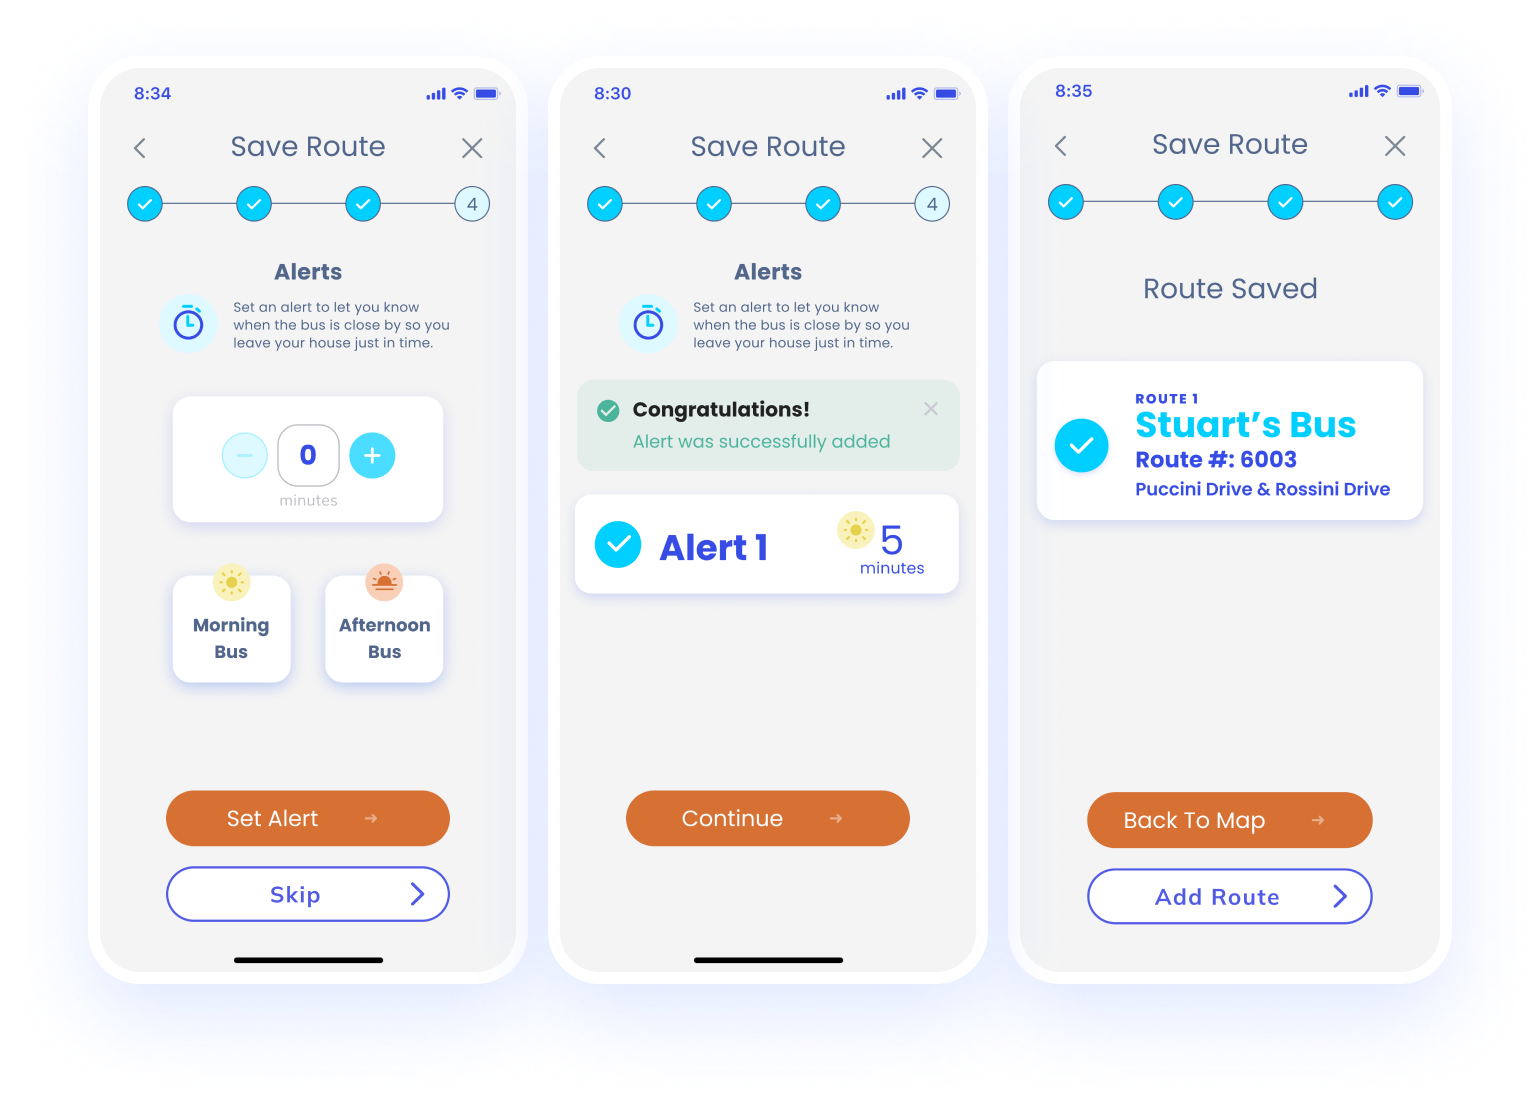
Final Thoughts
And finally…how did we pull all of this together? We used a Gantt Chart to help us stay on task, define and allocate responsibilities for each team member, as well as manage our workflow. We met regularly via Zoom meetings and constantly collaborated through Slack.
We leveraged our individual strengths to work on tasks well suited to each of us.
It was easy to lose focus and build out features we thought were good, but which might not have helped our users solve their problems. We often needed to pull back and refocus, asking ourselves, “Yes, but how would this help our users?” Constant testing was invaluable to the whole process.
In closing, we spent a tremendous amount of time thinking about the problem, before we started brainstorming ideas. Knowing we had strict timelines, did we regret taking this approach? Absolutely not! Doing this helped us focus on our user journey at every turn, ensuring we weren’t just designing another app for the sake of it, but providing a real, tangible solution. After all, wasn’t it Einstein who said “If I had an hour to solve a problem I’d spend 55 minutes thinking about the problem and five minutes thinking about solutions.”
Are you interested in cooperating with me? Contact me easily
